Figures & data

Table 1. Sequences for dsRNA
Table 2. Sequences of PCR primers
Figure 1. Design of ATOH1 small activating RNAs. The names of each small activating RNA target site relative to the transcription starting site (+1) on the ATOH1 promoter are indicated.
Figure 2. Screening of ATOH1 small activating RNAs in 293 T cells and mesenchymal stem cells. Cells were transfected with the indicated small activating RNAs using RNAiMAX at the indicated concentrations for 72 h. Mock samples were transfected in the absence of duplex RNA. Plasmid DNA was transfected at 1 µg/µl using Lipofectamine 3000. The transfected cells were subjected to RT–qPCR after RNA isolation, an RT reaction to generate cDNA and a Western blotting assay after protein isolation. A and B. Relative mRNA expression levels of the ATOH1 gene in 293 T cells (a) and mesenchymal stem cells (b) 72 h after transfection. C and D. ATOH1 protein levels assessed by Western blotting in 293 T cells (c) and mesenchymal stem cells (d) at 72 h after transfection. E and F. Relative ATOH1 mRNA expression levels in response to different small activating RNA concentrations.
Figure 3. Induction of hair cell progenitor cells. Mesenchymal stem cells were cultured in induction medium containing EGF, IGF-1 and bFGF for 4 weeks, and hair cell progenitor cell marker genes were detected. A. Mesenchymal stem cells were cultured in hair cell progenitor cell induction medium as described in the Materials and Methods. Total cellular RNA was isolated from the treated cells and reverse transcribed into cDNA, which was amplified by semiquantitative RT–PCR. The GAPDH gene was also amplified as a control for RNA loading. B. Treated cells were fixed and stained with an antibody against PAX8, and the nuclei were counterstained. Red arrows denote positively stained cells.
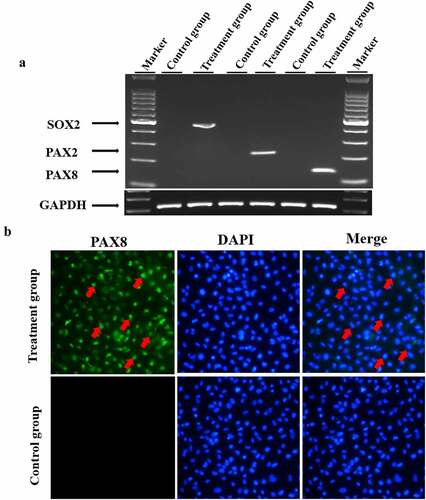
Figure 4. Validation of selected small activating RNAs (RAG9-1, RAG9-6 and RAG9-9) in hair cell progenitor cells. The 3 selected small activating RNAs, the plasmids containing the ATOH1 gene and the dsRNA were transfected into hair cell progenitor cells to verify the activation effect of small activating RNAs in hair cell progenitor cells. Then, a dose–response transfection was performed to determine the most potent concentration. As shown in A and B, expression of the ATOH1 gene was detected in the small activating RNA treatment group and the plasmid treatment group but not in the blank control group and the dsCon group. The results indicate that RAG9-1, RAG9-6 and RAG9-9 were able to activate the expression of the ATOH1 gene in progenitor cells. As shown in C, the expression of the ATOH1 gene was highest when the concentration of the 3 small activating RNAs was 10 nM. This result indicates that the most effective activation concentration for the small activating RNAs was 10 nM in hair cell progenitor cells.
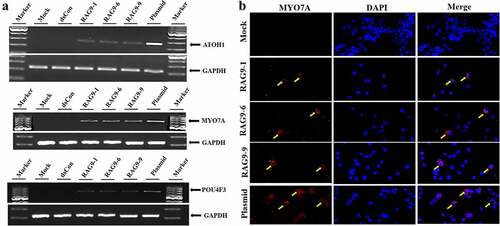
Figure 5. Induction of hair cell-like cells. Inner ear progenitor cells were transfected with the 3 selected small activating RNAs, the plasmid containing the ATOH1 gene and dsRNA for 10 days, and hair cell markers (ATOH1, POU4F3 and MYO7A) were detected. A. The expression of hair cell markers (ATOH1, MYO7A, POU4F3 and GAPDH) was detected in the RAG9-1, RAG9-6, RAG9-9 and plasmid groups using semiquantitative RT–PCR. B. The expression of MYO7A was examined using immunofluorescence technology. The expression of MYO7A was detected in the RAG9-1, RAG9-6, RAG9-9 and plasmid groups (as shown by the yellow arrow).