
Figures & data
Figure 1. Comparison of body weight (a), liver weight (b), food intake (c), fasting blood glucose (d), fasting insulin (e), IPGTT (f) and AUC (g) of mice in each group.
Figure 2. Comparison of liver TG content in mice of each group (a) and the effects of SIL on liver lipid deposition in HFD mice by H&E and oil red O staining (×400) (b).
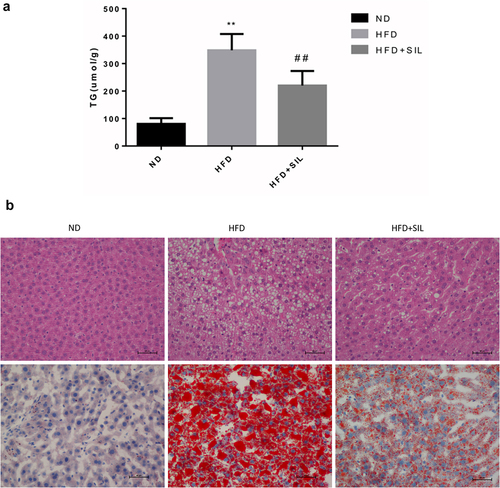
Table 1. Summary of MS/MS spectrum database search analysis
Figure 3. Experimental strategies for quantitative proteome analysis and quality control validation. (a) Pair wise Pearson’s correlation coefficients; (b) Average peptide mass error; (c) Length distribution of all identified peptides.
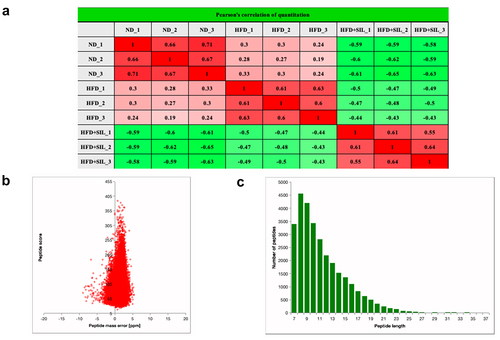
Table 2. List of proteins involved in sugar and lipid metabolism with at least 1.2-fold altered expression due to HFD and/or HFD+SIL
Figure 4. Sub-cellular functional annotations and GO analysis of identified proteins. (a) Sub-cellular localization of identified proteins; (b) GO annotation in terms of cellular component; (c) GO annotation in terms of molecular function; (d) GO annotation in terms of biological process.
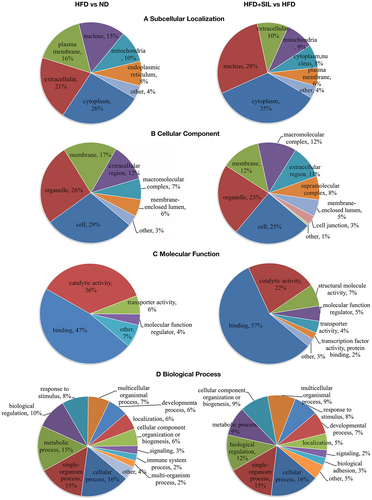
Figure 5. KEGG enrichment analysis of DEPs. (a) KEGG pathway enrichment; (b) Significance rankings of KEGG pathway enrichment in HFD versus ND; The pathway of up-regulated DEPs in HFD versus ND; The pathway of down-regulated DEPs in HFD versus ND; (c) Significance rankings of KEGG pathway enrichment in HFD+SIL versus HFD; The pathway of up-regulated DEPs in HFD+SIL versus HFD; The pathway of down-regulated DEPs in HFD+SIL versus HFD.
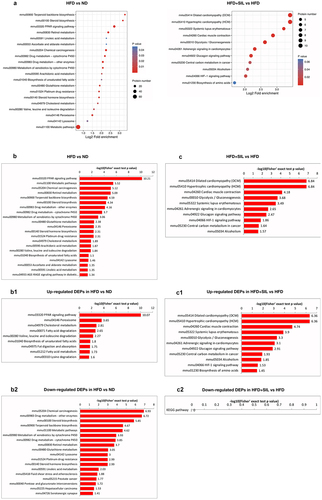
Figure 6. The relative protein expression of PLIN2, LPIN1, FDPS and GSTA1 in liver. *P < 0.05 and **P < 0.01 vs ND, #P < 0.05 and ##P < 0.01 vs HFD.
Data availability statement
All data are available in the article.