Figures & data
Figure 1. Volcano map, heatmap and venn diagram analysis of DEmRNAs in the GC/GD and GH/GD groups.
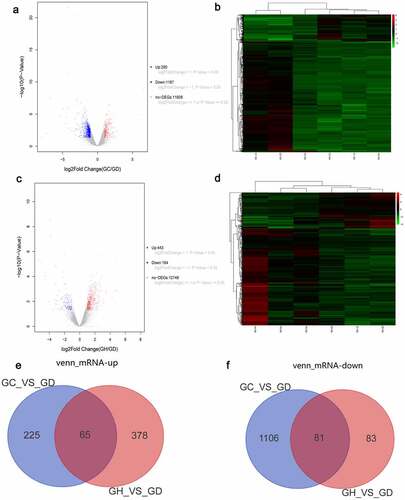
Figure 2. Volcano map, heatmap and Venn diagram analysis of DElncRNAs in the GC/GD and GH/GD groups.
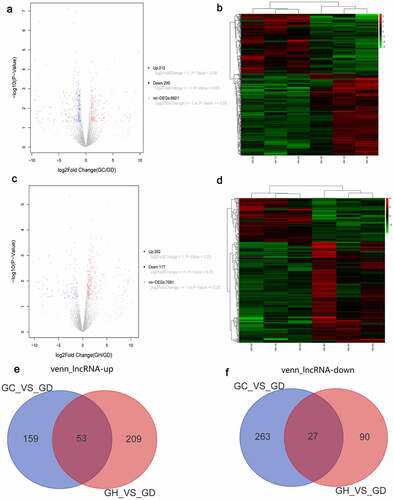
Figure 3. Volcano map, heatmap and Venn diagram analysis of DEmiRNAs in the GC/GD and GH/GD groups.
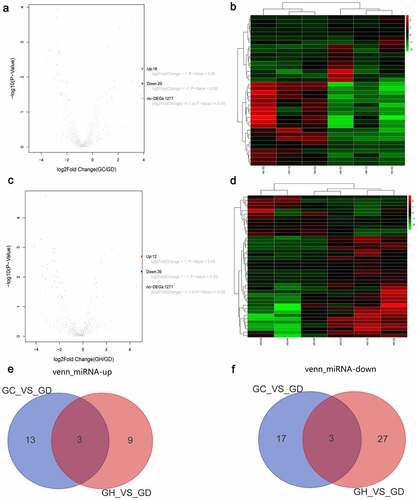
Figure 4. Significantlly enriched GO terms and KEGG pathways of common DEmRNAs.
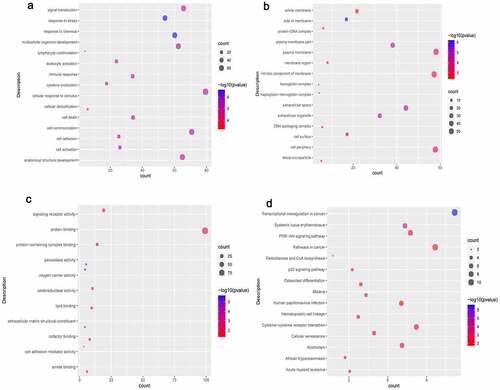
Table 1. DEmiRNA-DEmRNA targeted relationship
Figure 5. DEmiRNA-DElncRNA targeting network diagram (a) and DElncRNA-DEmiRNA-DEmRNA interaction network (b).
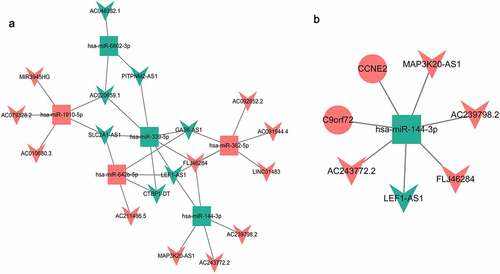
Table 2. Primer sequence in the RT-PCR
Figure 6. Expression validation of CCNE2, C9orf72, LEF1-AS1, MLK7-AS1, and hsa-miR-144-3p in blood samples by RT-PCR.
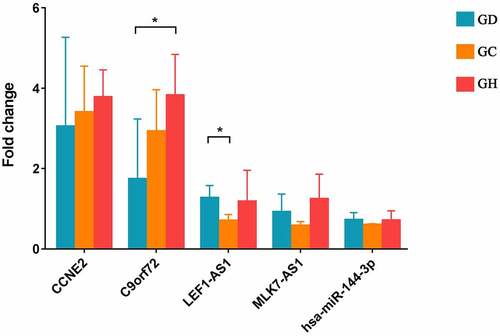
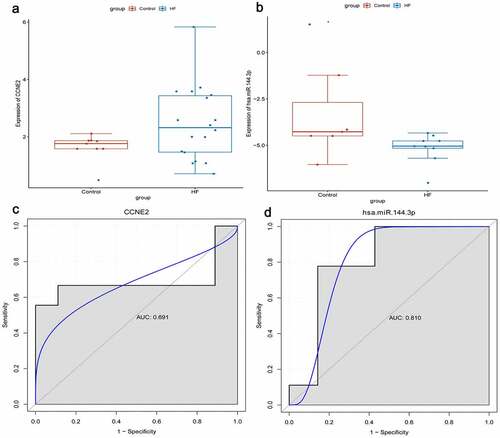
Figure 7. Expression validation and diagnostic analysis of CCNE2 and hsa-miR-144-3p.