Figures & data
Figure 1. The differential expression analysis of CATIP-AS1 in tissue samples (a) GEPIA analysis of CATIP-AS1 expression in THCA tissue samples. CATIP-AS1 was significantly downregulated in thyroid samples relative to the normal ones. (b) qRT-PCR analysis of CATIP-AS1 expression in clinical tissue samples. CATIP-AS1 expression was significantly downregulated in THCA tissue samples compared to the adjacent normal ones. (c) Statistical analysis of the relationship between CATIP-AS1 expression level and THCA patients’ survival time. Low expression of CATIP-AS1 was associated with THCA patients’ poor prognosis.
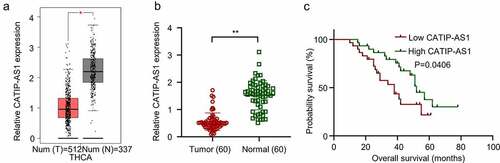
Figure 2. Functional study of CATIP-AS1 in THCA cells (a) The relative expression of CATIP-AS1 in different THCA cell lines and normal human thyroid cell line, Nthy-ori3-1, determined by qRT-PCR analysis (b) CCK-8 analysis of THCA cell proliferation after overexpressing CATIP-AS1. CATIP-AS1 overexpression significantly reduced THCA cell proliferation. (c) qRT-PCR analysis of CATIP-AS1 expression after overexpressing THCA cells with CATIP-AS1. CATIP-AS1 expression was significantly upregulated. (d) Colony formation assay analysis of THCA cell proliferative ability after transfection with pcDNA3.1-CATIP-AS1. Overexpression of CATIP-AS1 reduced the number of colonies formed in THCA cell. (e) Apoptosis analysis of THCA cells after overexpression with CATIP-AS1. Overexpression of CATIP-AS1 increased THCA cell apoptotic rate.
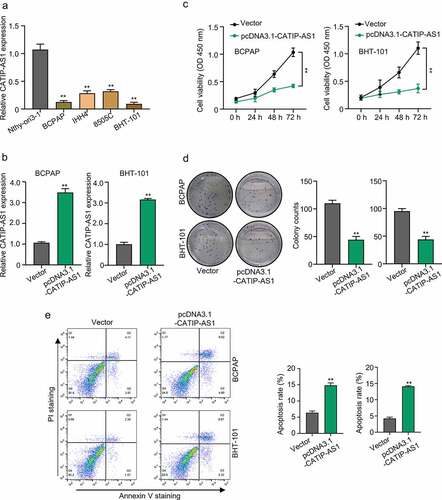
Figure 3. CATIP-AS1 suppresses the migration of THCA cell lines via the EMT pathway. (a) Transwell assay for the functional effect of CATIP-AS1 on the migration ability of the THCA cell lines. The migrative ability of THCA cell lines were inhibited after overexpression with CATIP-AS1. (b) Detection of EMT-related genes mRNA expression using qRT-PCR. E-cadherin and ZO-1 mRNA expression was markedly increased in both THCA cell lines overexpressed with CATIP-AS1 while the expression of N-cadherin and Vimentin was significantly repressed (c) Western blot analysis of EMT-related genes protein expression. E-cadherin and ZO-1 protein expression increased after overexpressing CATIP-AS1 in the THCA cell lines while N-cadherin and Vimentin protein expression was significantly repressed.
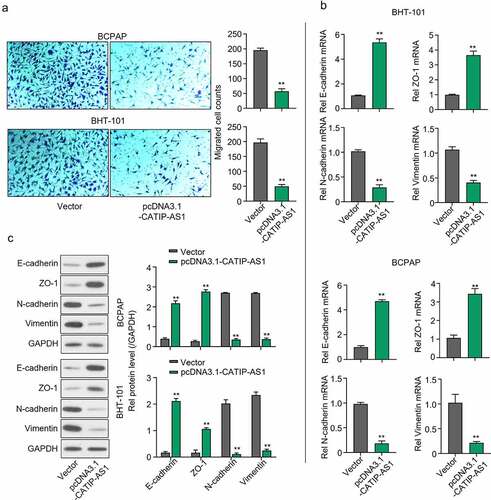
Figure 4. CATIP-AS1 directly sponge miR-515-5p in THCA cells (a) lncbase prediction result of CATIP-AS1 target miRNA. CATIP-AS1 sequence contained miR-515-5p seed region nucleotide sequences and could directly sponge miR-515-5p and inhibit its regulatory ability on its target mRNA in THCA cell. (b) Dual-Luciferase reporter assay to validate CATIP-AS1 and miR-515-5p binding ability. The miR-515-5p mimics significantly inhibited the luciferase activity of THCA cell lines co-transfected with CATIP-AS1 wild type (WT) plasmid but had no significant inhibiting effect on that of cells co-transfected with the CATIP-AS1 mutant type (Mut) plasmid. (c) Biotinylated RNA-pulldown assay. CATIP-AS1 probe significantly pull down more miR-515-5p in the THCA cell lines than the ordinary Oligo probe. (d) RIP-qRT-PCR analysis shows that more miR-515-5p and CATIP-AS1 was enriched in the Ago2 protein group compared to the IgG group. (e) QRT-PCR analysis of the relative expression of miR-515-5p in the THCA cell lines after CATIP-AS1 overexpression. The miR-515-5p expression was significantly inhibited.
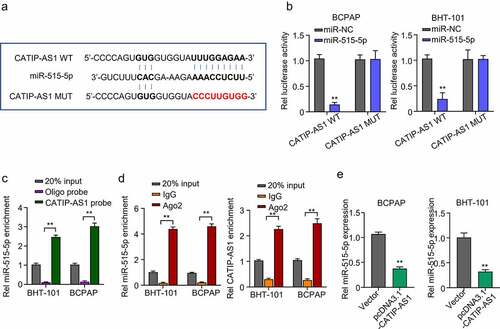
Figure 5. Smad4 is a regulatory target of miR-515-5p in THCA cells. (a) Starbase analysis predicted SMAD4 mRNA as a potential target miR-515-5p in THCA cells (b) Dual-Luciferase reporter assay. The luciferase activity of THCA cell lines co-transfected with miR-515-5p and SMAD4 wild type (WT) plasmid was significantly inhibited while that of cells co-transfected with SMAD4 mutant type (Mut) plasmid was not. (c) QRT-PCR analysis to measure the expression of SMAD4 mRNA after transfecting the THCA cell lines with miR-515-5p inhibitor or mimics. SMAD4 mRNA expression was significantly increased after miR-515-5p inhibition and was markedly repressed after overexpressing miR-515-5p (d) Western blot analysis. MiR-515-5p inhibition increased SMAD4 protein expression while miR-515-5p overexpression reduced it.
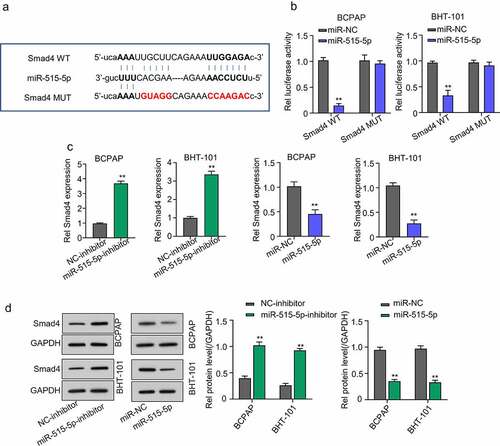
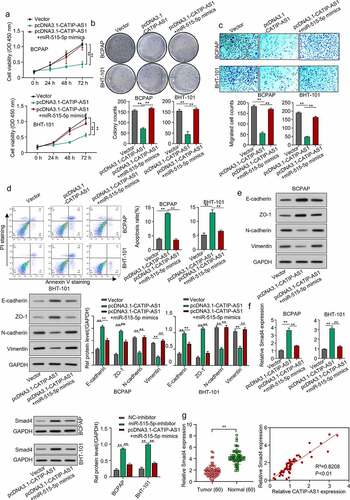
Figure 6. CATIP-AS1 suppresses the migration of THCA cell in vivo via miR-515-5p/SMAD4 pathway. (a) CCK-8 analysis of THCA cell proliferation after CATIP-AS1 and miR-515-5p overexpression. The cell proliferation was restored by miR-515-5p co-transfection (b) Colony formation assay. Co-transfecting miR-515-5p mimics reduced the number of colonies formed in the THCA cell lines. (c) Transwell assay. THCA cell migrative ability was restored by miR-515-5p mimics (d) Cell apoptosis assay. MiR-515-5p mimics reduced the apoptosis of THCA cell line (e) Western blot analysis of E-cadherin, ZO-1, N-cadherin, and Vimentin protein expression level in THCA cell lines after overexpressing CATIP-AS1 and co-transfection with miR-515-5p (f) SMAD4 expression level in THCA cell lines measured by qRT-PCR and Western blot analysis, after CATIP-AS1 and miR-515-5p overexpression. The relative expression of SMAD4 was significantly reduced after co-transfecting THCA cell lines with miR-515-5p mimics (g) QRT-PCR analysis of SMAD4 expression in THCA tumor samples and its association with CATIP-AS1 expression. SMAD4 was significantly upregulated in THCA samples compared to the normal ones and its expression was positively correlated with CATIP-AS1 expression.