Figures & data
Table 1. DAI scoring criteria
Figure 1. BBR relieves colitis-induced pyroptosis and intestinal mucosal barrier defects. Animal experiment flow chart. (b) DAI scores of mice in each group. (c) Normalization of mouse body weight. (d) The length of the colon of each group of mice. (e) Macroscopic score of colon tissue in each group. (f) HE staining to detect the pathological condition of colon tissue. (g) TUNEL staining to detect apoptosis. (h-j) ELISA method to detect IL-12, IL-23 and TNF-α in the serum of mice. (k) Assessment of intestinal permeability. L. qRT-PCR detection of occludin mRNA. B-E, n = 10, F-L, n = 5; The data in the Fig. were all measurement data, and manifestation of which was as mean ± SD. * vs the Normal, P < 0.05; # vs the DSS, P < 0.05.
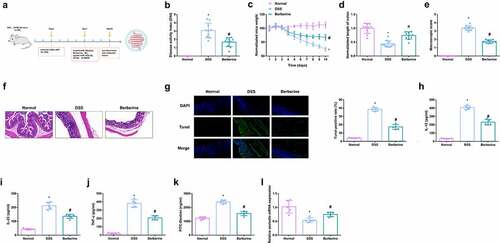
Table 2. RT-qPCR primer sequence
Figure 2. MiR-103a-3p eases DSS-stimulated colitis. A/B. qPCR to detect miR-103a-3p in mouse colon tissue. C. DAI scores of mice in each group. D. Normalization of mouse body weight. E. The length of the colon of each group of mice. F. Macroscopic score of colon tissue in each group. G. HE staining to detect the pathological condition of colon tissue. H. TUNEL staining to detect apoptosis. I-K. ELISA method to detect IL-12, IL-23 and TNF-α in the serum of mice. L. Assessment of intestinal permeability. M. qRT-PCR detection of occludin mRNA. C-F, n = 10; A&B&G-M, n = 5; The data in the Fig. were all measurement data, and manifestation of which was as mean ± SD. + vs the DSS+NC, P < 0.05.
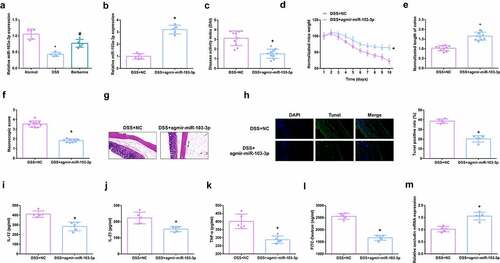
Figure 3. MiR-103a-3p targets BRD4. A/B. qPCR to detect BRD4 in mouse colon tissue. B. Western Blot detection of BRD4 in mouse colon tissue. C. Bioinformatics website forecast of the binding site of miR-103a-3p with BRD4. D. The luciferase activity assay verification of the targeting link of miR-103a-3p with BRD4, N = 3. E/F. qPCR and Western Blot detection of BRD4 in mouse colon tissue with elevated miR-103a-3p. n = 5; The data in the Fig. were all measurement data, and manifestation of which was as mean ± SD. * vs the Normal, P < 0.05. # vs. the DSS, P < 0.05. + vs the DSS+NC, P < 0.05.
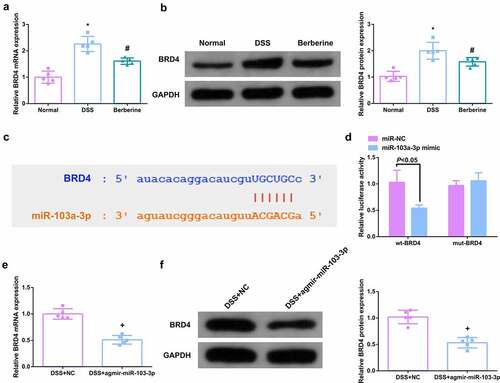
Figure 4. Depressive BRD4 mitigates DSS-induced colitis damage. A.qPCR detection of BRD4 after repressing BRD4. B. DAI scores of mice in each group. C.Normalization of mouse body weight. D. The length of the colon of each group of mice. E. Macroscopic score of colon tissue in each group. F. HE staining to detect the pathological condition of colon tissue. G. TUNEL staining to detect apoptosis. H-J. ELISA method to detect IL-12, IL-23 and TNF-α in the serum of mice. K. Assessment of intestinal permeability. L. qRT-PCR detection of occludin. B-E, n = 10; A&B&F-L, n = 5; The data in the Fig. were all measurement data, and manifestation of which was as mean ± SD. + vs the DSS+sh-NC, P < 0.05.
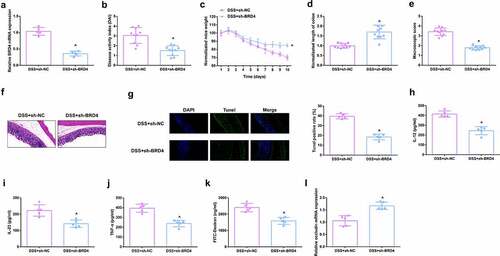
Figure 5. BBR motivates cell advancement, and alleviates intestinal barrier damage in IL-6-induced colitis model in vitro. A. CCK-8 method to determine the cytotoxicity of BBR (0–60 mM) to NCM460 cells. B. CCK-8 method to determine the cell viability of each group. B. Measurement of apoptosis via flow cytometry. C-E. ELISA detection of inflammatory factors in the cell supernatant. F. TEER measurement of the barrier’s integrity. G/H. qPCR and Western Blot detection of miR-103a-3p with BRD4 in cells of each group. N = 3; The data in the Fig. were all measurement data, and manifestation of which was as mean ± SD; a vs the Control, P < 0.05; b vs. the IL-6, P < 0.05.
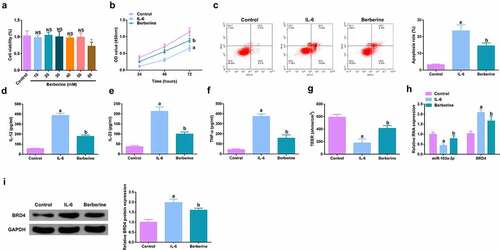
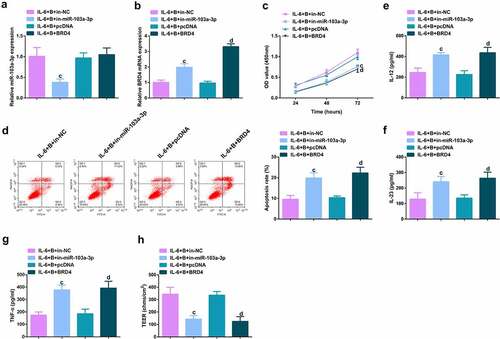
Figure 6. Depressive miR-103a-3p or enhancive BRD4 turned around BBR’s therapeutic action. A/B. qPCR to verify transfection efficiency. C. CCK-8 method to determine the cell viability of each group. D. Measurement of apoptosis via flow cytometry. E-G. ELISA detection of inflammatory factors in the cell supernatant. H. TEER measurement of the barrier’s integrity. N = 3; The data in the Fig. were all measurement data, and manifestation of which was as mean ± SD. c vs the IL-6 + B+ in-NC, P < 0.05. d vs. the IL-6 + B+ pcDNA, P < 0.05.
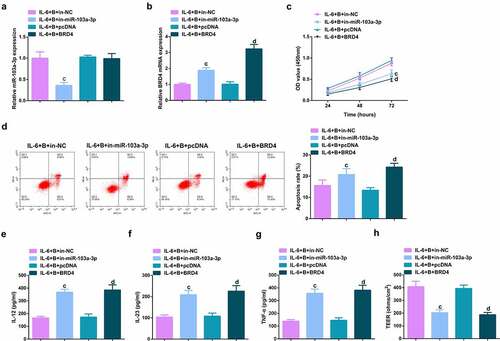
Figure 7. Depressive miR-103a-3p or enhancive BRD4 turns around BBR’s therapeutic action. A. qPCR to verify transfection efficiency. B. CCK-8 method to determine the cell viability of each group. C. Measurement of apoptosis via flow cytometry. D-F. ELISA detection of inflammatory factors in the cell supernatant. G. TEER measurement of the barrier’s integrity. N = 3; The data in the Fig. were all measurement data, and manifestation of which was as mean ± SD. c vs. the IL-6 + B+ in-NC, P < 0.05. e vs. the IL-6 + B+ in-miR-103a-3p+si-NC, P < 0.05.
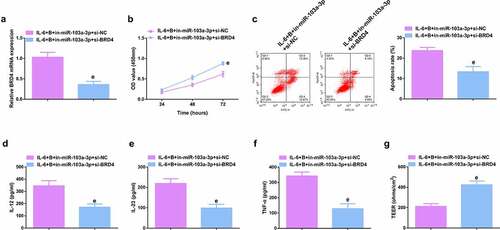
Figure 8. BBR restrains Wnt/β-catenin pathway via modulating the miR-103a-3p/BRD4 axis. A, B. Western Blot detection of β-catenin in colon tissues of each group, in vivo experiment, n = 5; in vitro experiment, N = 3. The data in the Fig. were all measurement data, and manifestation of which was as mean ± SD. * vs. the Normal, P < 0.05. # vs. the DSS, P < 0.05. + vs. the D+ NC, P < 0.05; a vs. the control, P < 0.05. b vs. the IL-6, P < 0.05; c vs. the IL-6 + B+ in-NC, P < 0.05. d vs. the IL-6 + B+ pcDNA, P < 0.05.
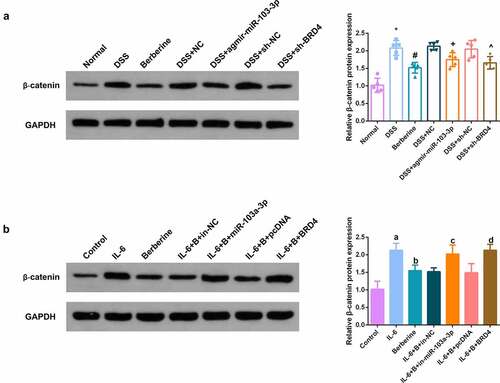
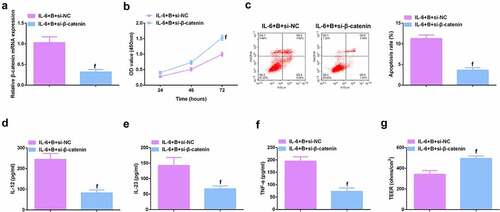
Figure 9. β-catenin knockdown further promotes the protective effect of Berberine on colitis in vitro. A. qPCR detection of β-catenin mRNA expression after knocking down β-catenin; B. CCK-8 to detect the proliferation ability of cells after knocking down β-catenin; C. Flow cytometry to detect cell apoptosis after knocking down β-catenin; D-F. ELISA to detect the levels of inflammatory cytokines (IL-12, IL-23, TNF-α) in the supernatant of cells after β-catenin knockdown; G. The level of inflammatory cytokines (IL-12, IL-23, TNF-α) in cell supernatant fluid, N = 3. The data in the Fig. were all measurement data, and manifestation of which was as mean ± SD; f, vs. the IL-6 + B = si-NC group, P < 0.05.
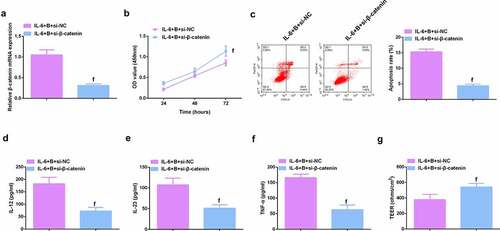
Image 1. BBR motivates cell advancement, and alleviates intestinal barrier damage in IL-6-induced colitis model in vitro. A.qPCR detection of BRD4 after repressing BRD4. B. Normalization of mouse body weight. C. The length of the colon of each group of mice. D. Macroscopic score of colon tissue in each group. E. HE staining to detect the pathological condition of colon tissue. F. TUNEL staining to detect apoptosis. G-I. ELISA method to detect IL-12, IL-23 and TNF-α in the serum of mice. J. Assessment of intestinal permeability. K. Western Blot detection of occludin. C-E, n = 10; A&B&F-L, n = 5; The data in the Fig. were all measurement data, and manifestation of which was as mean ± SD. + vs. the DSS+sh-NC, P < 0.05.
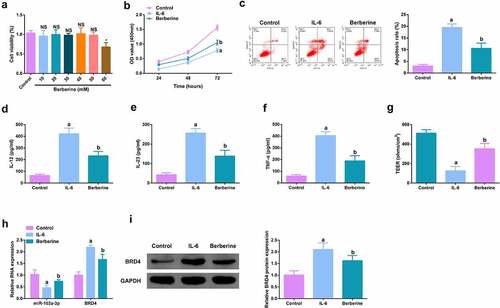
Image 2. Depressive miR-103a-3p or enhancive BRD4 turns around BBR’s therapeutic action. A/B. qPCR to verify transfection efficiency. C. CCK-8 method to determine the cell viability of each group. D. Measurement of apoptosis via flow cytometry. E-G. ELISA detection of inflammatory factors in the cell supernatant. H. TEER measurement of the barrier’s integrity. N = 3; The data in the Fig. were all measurement data, and manifestation of which was as mean ± SD. c vs. the IL-6 + B+ in-NC, P < 0.05. d vs. the IL-6 + B+ pcDNA, P < 0.05.
Ima7ge 3. Depressive miR-103a-3p or enhancive BRD4 turns around BBR’s therapeutic action. A. qPCR to verify transfection efficiency. B. CCK-8 method to determine the cell viability of each group. C. Measurement of apoptosis via flow cytometry. D-F. ELISA detection of inflammatory factors in the cell supernatant. G. TEER measurement of the barrier’s integrity. N = 3; The data in the Fig. were all measurement data, and manifestation of which was as mean ± SD. c vs. the IL-6 + B+ in-NC, P < 0.05. e vs. the IL-6 + B+ in-miR-103a-3p+si-NC, P < 0.05.
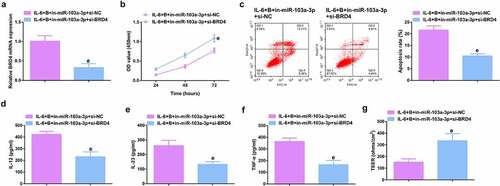
Image 4. Knockdown β-catenin further promotes the protective effect of Berberine on colitis in vitro. A.qPCR detection of β-catenin mRNA expression after β-catenin knockdown; B. CCK-8 to detect the proliferation ability of cells after β-catenin knockdown; C. Flow cytometry to detect cell apoptosis after β-catenin knockdown; D-F. ELISA to detect the levels of inflammatory factors (IL-12, IL-23 and TNF-α) in the supernatant of cells after β-catenin knockdown; G. The levels of inflammatory factors (IL-12, IL-23, TNF-α) in cell supernatant fluid. N = 3; The data in the Fig. were all measurement data, and manifestation of which was as mean ± SD. f, vs. the IL-6 + B = si-NC, P < 0.05.