
Figures & data
Figure 1. Hederagenin increases survival rate and attenuates lung injury in rats with sepsis-induced acute lung injury. (a) Schematic design of the experimental procedure. Rats underwent sham or cecal ligation and puncture (CLP) operation on day at 0. After CLP surgery, rats were immediately given different dosage of hederagenin, gavage administration. Twelve hours after operation, 10 rats in each group were randomly selected to observe the survival rate (10 days or until the model group died); the other part of rats were sacrificed to collect broncho alveolar lavage fluid (BALF) and lung tissues. (b) The survival rate of rats was recorded until the model group died. Results were expressed as percent survival, n = 10. (c) Lung tissue sections stained with hematoxylin and eosin. (Original magnification ×200, scale bar 100 μm). (d) Semiquantitative analysis of lung tissue by lung injury score. (e) The pulmonary edema was measured by wet to dry weight ratio. (f-g) Myeloperoxidase (MPO) (f) and superoxide dismutase (SOD) (g) activities in lung tissue. (h-i) Malondialdehyde (MDA) (h) and glutathione (GSH) (i) content in lung tissue. Results were presented as mean ± standard deviation, n = 6. **P < 0.01 versus Sham group; #P < 0.05 versus CLP group; ##P < 0.01 versus CLP group.
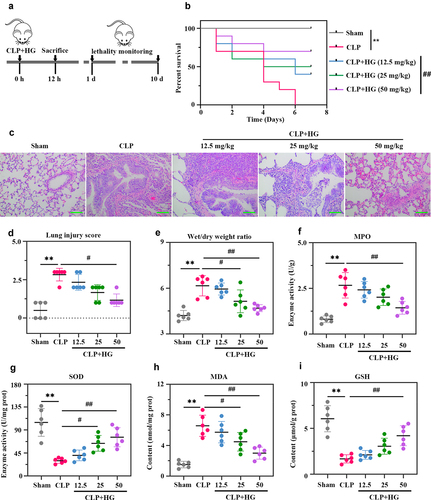
Figure 2. Hederagenin suppresses M1 macrophage activation and inflammation response in septic lung tissue. (a) Total cell, neutrophil, macrophage and lymphocyte counts in BALF. (b) Inflammatory factor (tumor necrosis factor-α (TNF-α), interleukin 6 (IL-6) and monocyte chemoattractant protein-1 (MCP-1) levels in BALF. (c) Dual immunofluorescence staining of CD68 (green) and CD86 (red) in the different groups after CLP. (d) Immunofluorescence staining of inducible nitric oxide synthase (iNOS) in the different groups after CLP (Original magnification ×400, scale bar 50 μm). (e-f) iNOS and cyclooxygenase-2 (COX-2) gene (e) and protein (f) expression in lung tissue were detected by quantitative reverse transcription polymerase chain reaction (RT-qPCR) and western blot. (g) Representative images show the expression levels of iNOS and COX-2 by western Blot analysis with GAPDH as a loading control. Results were presented as mean ± standard deviation, n = 6. **P < 0.01 versus Sham group; #P < 0.05 versus CLP group; ##P < 0.01 versus CLP group.
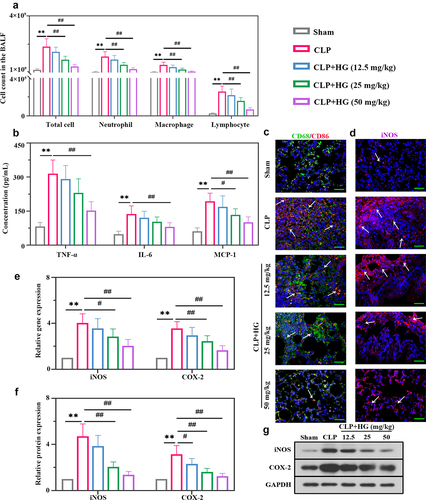
Figure 3. Hederagenin inhibits the activation of NLRP3 inflammasome in septic lung tissue. (a) Immunofluorescence staining of NOD-like receptor family pyrin domain containing 3 (NLRP3) and dual immunofluorescence staining of NLRP3 (red) and CD68 (green) in the different groups after CLP (Original magnification ×400, scale bar 50 μm). White arrows indicated positive staining. (b) Protein expression levels of NLRP3 and cleaved-caspase-1 in lung tissue were measured by western blot. Quantitative analysis of the blots was normalized to GAPDH. (c-d) Inflammatory cytokine levels were detected in the BALF (c) and lung samples (d). Results were presented as mean ± standard deviation, n = 6. **P < 0.01 versus Sham group; #P < 0.05 versus CLP group; ##P < 0.01 versus CLP group.
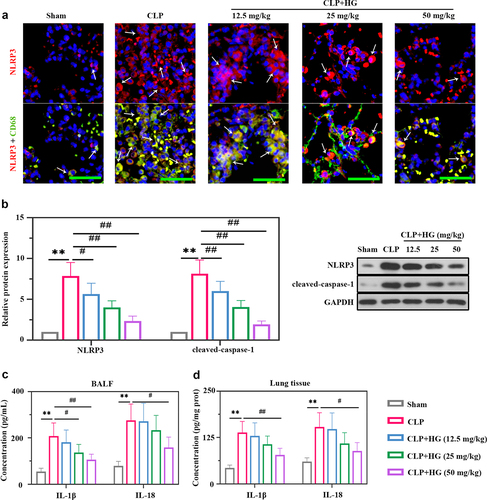
Figure 4. Hederagenin inhibits NF-κB signaling pathway in septic lung tissue. (a) Immunohistochemistry staining of p-p65 in the different groups after CLP (Original magnification ×400, scale bar 50 μm). (b) Protein expression levels of p-IκBα, IκBα, p-p65 and nuclear p65 in lung tissue were measured by western blot. Quantitative analysis of the blots was normalized to GAPDH or Histone H3. Results were presented as mean ± standard deviation, n = 6. **P < 0.01 versus Sham group; #P < 0.05 versus CLP group; ##P < 0.01 versus CLP group.
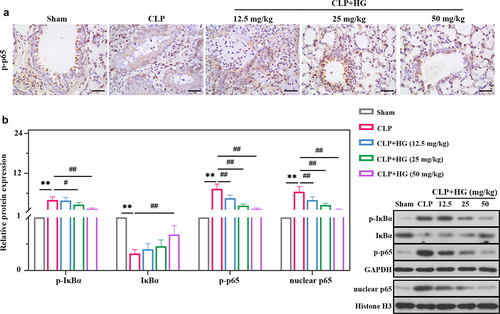
Figure 5. Effects of hederagenin on LPS-induced macrophages. THP-1 cells were treated with 100 ng/mL phorbol-12-myristate-13 acetate (PMA) for 24 h to differentiate into macrophage-like cells. Then, the cells were co-cultured with 100 μM hederagenin, followed by 100 ng/mL LPS stimulation for 24 h to activate THP-1 macrophages. (a) Protein expression levels of NLRP3 and cleaved-caspase-1 were measured by western blot after macrophages were treated as indicated. (b) Dual immunofluorescence staining of NLRP3 (red) and ASC (green). (Original magnification ×400, scale bar 50 μm). (c) Inflammatory cytokine levels (IL-1β, IL-18, IL-6 and MCP-1) were detected in macrophages. (d) Flow cytometry was performed to analyze the expression of CD86 on macrophages. (e) Protein expression levels of iNOS and COX-2 in macrophages were measured by western blot. (f) Immunofluorescence staining of p65. (Original magnification ×400, scale bar 50 μm). (g) Protein expression levels of p-IκBα, IκBα, p-p65 and nuclear p65 in macrophages were measured by western blot. (h) Representative images show the expression levels of iNOS, COX-2, NLRP3, cleaved-caspase-1, p-IκBα, IκBα, p-p65 and nuclear p65 by western Blot analysis with GAPDH or Histone H3 as a loading control. Results were presented as mean ± standard deviation, n = 3. No significant (ns), P > 0.05 versus Control group. **P < 0.01 versus Control group; ##P < 0.01 versus LPS group.
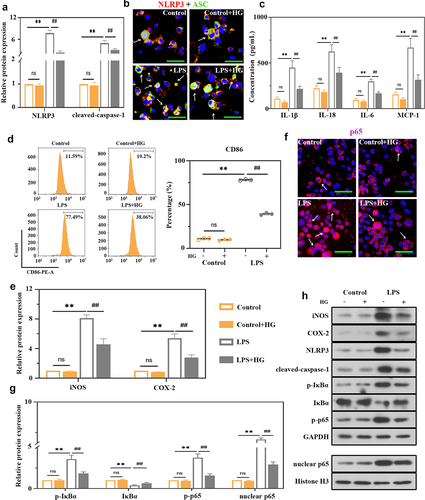
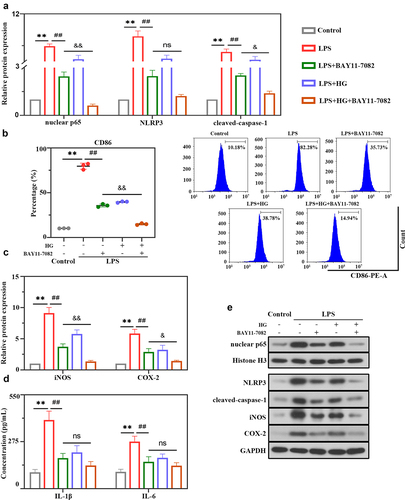
Figure 6. Hederagenin suppresses LPS-induced NLRP3 inflammasome activation and M1 macrophage polarization via NF-κB signaling pathway. NF-κB inhibitor was used to further explore the mechanism of hederagenin. The differentiated THP-1 cell were treated with hederagenin and/or BAY11-7082 for 1 h, followed by 100 ng/mL LPS stimulation for 24 h. (a) Protein expression levels of nuclear p65, NLRP3 and cleaved-caspase-1 were measured by western blot after macrophages were treated as indicated. (b) Flow cytometry was performed to analyze the expression of CD86 on macrophages. (c) Protein expression levels of iNOS and COX-2 were measured by western blot. (d) Inflammatory cytokine levels (IL-1β and IL-6) were detected in macrophages. (e) Representative images show the expression levels of nuclear p65, NLRP3, cleaved-caspase-1, iNOS and COX-2 by Western Blot analysis with GAPDH or Histone H3 as a loading control. Results were presented as mean ± standard deviation, n = 3. **P < 0.01 versus Control group; ##P < 0.01 versus LPS group; No significant (ns), P > 0.05 versus LPS+BAY11-7082 group; &P < 0.05 versus LPS+BAY11-7082 group; &&P < 0.01 versus LPS+BAY11-7082 group.
Data availability statement
The data that support the findings of this study are available from the corresponding author upon reasonable request.