
Figures & data
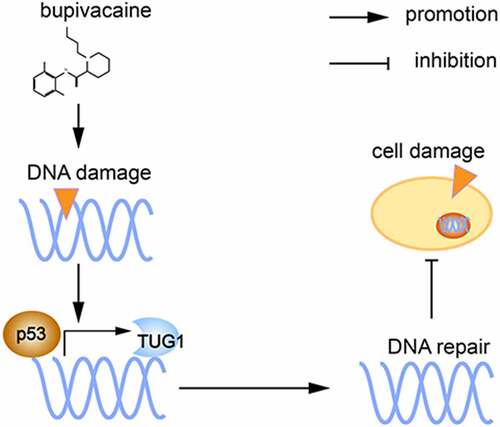
Table 1. The primer sequences for qPCR
Table 2. The target sequences of siRNA
Figure 1. Bup caused DRG cell damage. (a): Bup decreased DRG cells viability in concentration dependent manner. After DRG cells were treated with different concentrations (0, 1, 2, 2.5, 2.75, 3, 4, 5 mM) of bup for 3 h, CCK-8 assays were performed (n = 6), One-way ANOVA with Tukey’s test, vs con, *P < 0.05, ***P < 0.001. (b): Representative images shown cell injuries after bup challenges. Red arrows indicated broken filaments, white arrow heads shown shrunk cell bodies. (c&d): Bup increased the ratio of apoptosis cells. DRG neurons were isolated from mouse and then cultured in media with or without 2 mM bup, the numbers of cells in apoptosis were measured via TUNEL (green) staining, green fluorescence indicates apoptosis cells; the analysis graph for the ratio of apoptosis cells (n = 3), Student’s T test, vs con, **P < 0.01.
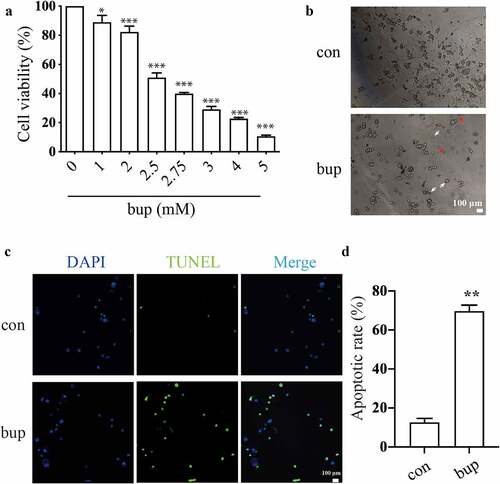
Figure 2. Bup caused DNA damage in DRG cell. (A&B): Bup increased γ-H2AX protein expression. After DRG cells treated with or without bup (1 mM, 2 mM) for 3 h, western blot detected γ-H2AX protein expression (n = 3), One-way ANOVA with Tukey’s test, vs con, *P < 0.05. (c-f): Bup induced DNA damage. After cells were treated with or without 2 mM bup for 3 h, comet assay was complemented to test DNA damage, images show the comet track. The analysis graph for HeadDNA%, TailDNA% and Olivetailmoment were presented in Figure d-f. three biological replicates for each exposure condition were pooled and 60 random cells per slide were assessed for DNA damage (n = 3), Student’s T test analysis the result, vs con, ***P < 0.001.
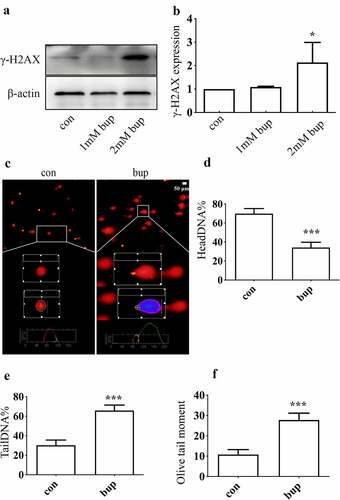
Figure 3. P53 induced DNA repair to alleviate DNA and cell damage. (a-c): Bup significant increased p53 mRNA and protein expression. After cells were planted for 24 h, DRG cells were treated with 0 mM, 1 mM and 2 mM bup for 3 h, q-PCR and western blot were complemented to test p53 mRNA and protein expression (n = 3), One-way ANOVA with Tukey’s test, vs con, **P < 0.01, *P < 0.05, ***P < 0.001. (d): Q-PCR detected the silence effect of p53 siRNA-1 was best. DRG cells were treated with p53siRNA for 24 h, Q-PCR was complemented to test p53 mRNA expression (n = 3), One-way ANOVA with Tukey’s test, vs con, ***P < 0.001. (e-g): P53 siRNA increased γ-H2AX protein expression induced by bup. DRG cells were treated with or without p53 siRNA for 24 h, replace the medium with normal medium for 24 h, cells were treated with or without 2 mM bup, western blot was complemented to test p53 protein and γ-H2AX protein expression (n = 3), One-way ANOVA with Tukey’s test, vs con, **P < 0.01; vs bup, ###P < 0.01. (f): P53 siRNA decreased cells viability induced by bup. DRG cells were treated as above, CCK-8 was complemented to test cell viability (n = 6), One-way ANOVA with Tukey’s test, vs con, ***P < 0.001; vs bup, #P < 0.05.
Figure 4. P53 siRNA inhibited DNA repair to alleviate DNA and cell damage. (a): Images show the comet track detected by Comet assay. DRG cells were treated with or without p53 siRNA for 24 h, replace the medium with normal medium, after more 24 h, cells were treated with or without 2 mM bup. (b-d): The analysis graph for HeadDNA%, TailDNA% and Olivetailmoment were presented in Figure b-d; One-way ANOVA with Tukey’s test, vs con, ***P < 0.001; vs bup, ##P < 0.01.
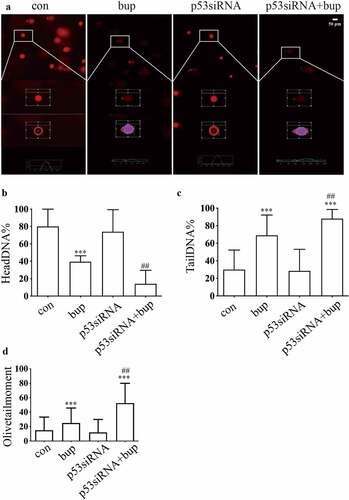
Figure 5. P53siRNA increased the ratio of apoptosis cells. (A&B): DRG cells were treated with or without p53 siRNA for 24 h, replace the medium with normal medium, after more 24 h, cells were treated with or without 2 mM bup, the numbers of cells in apoptosis were measured via TUNEL (green) staining, green fluorescence indicates apoptosis cells; the analysis graph for the ratio of apoptosis cells (n = 3), One-way ANOVA with Tukey’s test, vs con, *P < 0.05, ***P < 0.001; vs bup, ###P < 0.001.
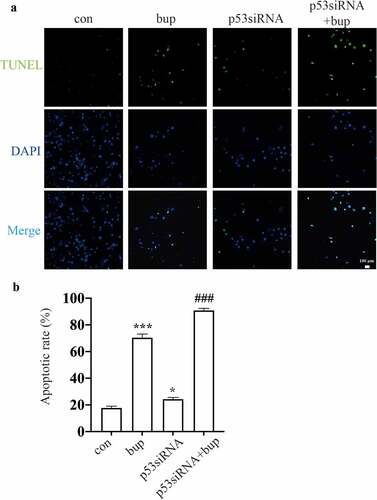
Figure 6. TUG1 was a protective factor in bup induced DRG damage. (a): P53 siRNA downregulated lncRNA TUG1 expression. After cells were planted for 24 h, DRG cells were treated with p53 siRNA for 24 h, q-PCR was complemented to test TUG1 expression (n = 3), One-way ANOVA with Tukey’s test, ***P < 0.001. (b): Q-PCR detected the silence effect of TUG1 siRNA-1 and TUG1 siRNA-2 was best. After cells were planted for 24 h, DRG cells were treated with TUG1 siRNA for 24 h, q-PCR was complemented to test TUG1 expression (n = 3), One-way ANOVA with Tukey’s test, vs con, ***P < 0.001. (c-f): Comet assay detected TUG1 siRNA aggravates DNA damage induced by bup. After cells were planted for 24 h, DRG cells were treated with or without TUG1siRNA for 24 h, replace the medium with normal medium, after more 24 h, cells were treated with or without 2 mM bup, comet assay was complemented to test DNA damage (n = 3), One-way ANOVA with Tukey’s test, vs con, ***P < 0.001; vs bup, #P < 0.001, ###P < 0.001. (g): TUG1 siRNA decreased cells viability induced by bup. After cells were treated as above, CCK-8 was complemented to test cell viability (n = 6), One-way ANOVA with Tukey’s test, vs con, **P < 0.01,***P < 0.001; vs bup, #P < 0.05.
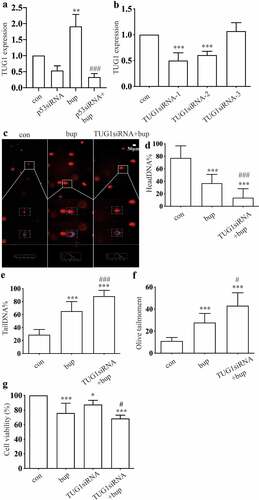
Figure 7. P53 and TUG1 share a common expression site. Blue fluorescence site is DAPI stained cell nucleus; red fluorescence is the lncRNA TUG1 expression site labeled in the FISH partial experiment; green fluorescence is the p53 protein expression site stained.
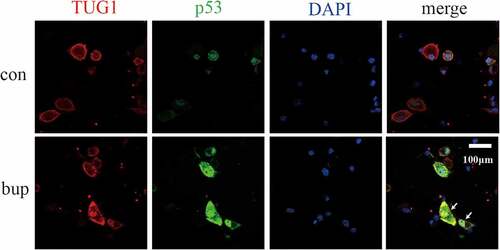
Figure 8. Expression of TUG1, P53 mRNA and protein, γ- H2AX protein in DRG of lumbosacral region of mice after intrathecal injection of bup. (a&b): Bup increased TUG1 and p53 mRNA expression in DRG tissues of mice. We injected 0.9% normal saline, 0.5% bup into the subarachnoid space of mice to simulate clinical subarachnoid anesthesia, DRG of T10-L5 were separated after 30 minutes, the expression of lncRNA TUG1 and mRNA p53 was detect by Q-PCR (n = 3), One-way ANOVA with Tukey’s test analysis, vs ns, **P < 0.01, ***P < 0.001. (c-e): Bup increased p53 and γ- H2AX protein expression in DRG tissues of mice. We injected normal saline, 0.5% bup, 0.75% bup into the subarachnoid space of mice, DRG of T10-L5 were separated after 30 minutes, the expression p53 and γ- H2AX protein expression was detect by western blot (n = 3), One-way ANOVA with Tukey’s test analysis, vs ns, *P < 0.05, **P < 0.01, ***P < 0.001.
Figure 9. Proposed mechanism: bupivacaine produce DNA damage in DRG cells, p53 expression increased and promote lincRNA TUG1expression as a transcription factor, final alleviate DNA damage and thereby reduce cell damage.
