Figures & data
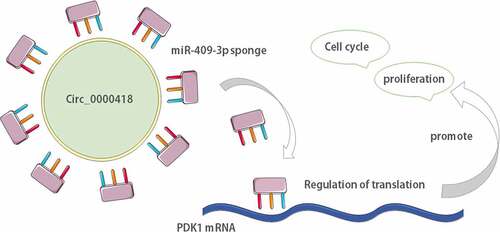
Figure 1. Circ_0000418 expression is significantly up-regulated in glioma a. The microarray dataset GSE146463 was downloaded from GEO database to analyze the differentially expressed circRNAs between glioblastoma patient derived cells and neural progenitor cells, and the volcano plot showed these circRNAs. The yellow indicated the down-regulated circRNAs, and the blue indicated the up-regulated circRNAs. b. Heat map was generated to show 8 representative up-regulated circRNAs in glioma tissues. c. Circ_0000418 expression in 47 cases of glioma tissues and normal tissues was measured by qPCR. d. Circ_0000418 expression levels in NHA cells and glioma cells (U-87 MG, U-138 MG, U-118 MG, T98-G, LN-229, LN-18) were detected by qPCR. ** P < 0.01, *** P < 0.001.
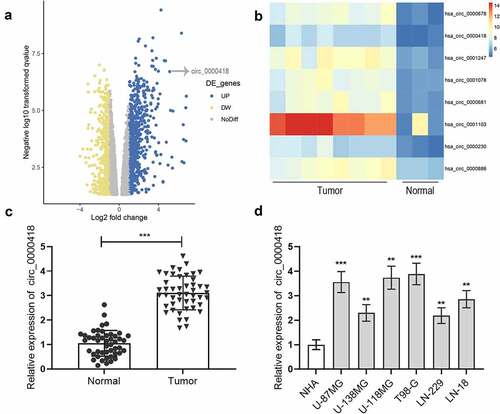
Figure 2. The biological function of circ_0000418 in glioma a-b. qPCR was carried out to detect the transfection efficiency of circ_0000418 overexpression plasmid and two circ_0000418 siRNAs. c-d. The effects of overexpression or knockdown of circ_0000418 on the growth of LN-229 and T98-G cells were analyzed using CCK-8 assay (c) and BrdU assay (d). e. Flow cytometry was executed to detect the effect of overexpression or knockdown of circ_0000418 on the cell cycle progression of LN-229 and T98-G cells. * P < 0.05, ** P < 0.01, *** P < 0.001.
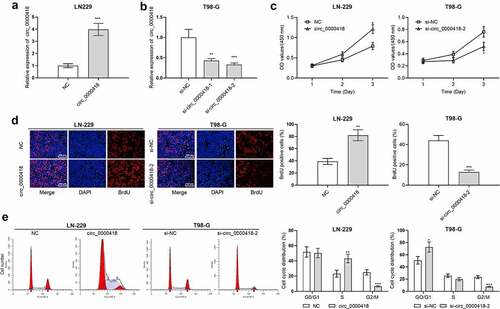
Figure 3. Circ_0000418 directly targets miR-409-3p a. The subcellular location of circ_0000418 in LN-229 and T98-G cells was evaluated by qPCR after that the nuclear and cytoplasmic fractions of glioma cells were isolated. b. The Circular RNA Interactome online database was employed to predict the binding site of circ_0000418 to miR-409-3p. c. WT circ_0000418 and MUT circ_0000418 were co-transfected with miR mimics or miR inhibitors into LN-229 and T98-G cells, respectively, and the dual-luciferase reporter gene system was employed to measure luciferase activity. d. The interaction between circ_0000418 and miR-409-3p was further validated using RIP assay. e. The effect of overexpression/knockdown of circ_0000418 on miR-409-3p expression in glioma cells was examined by qPCR. f. MiR-409-3p expression in 47 cases of glioma tissues and normal tissues was examined by qPCR. g. Pearson correlation analysis was performed to analyze the correlation between miR-409-3p expression and circ_0000418 expression in glioma tissues. ** P < 0.01, *** P < 0.001.
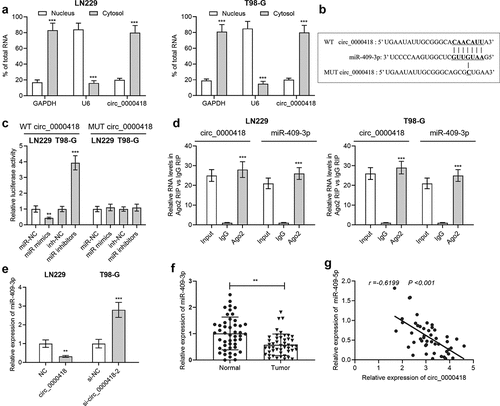
Figure 4. Effects of Circ_0000418 and miR-409-3p on the biological functions of glioma cells a. The transfection efficiency of circ_0000418 overexpression plasmid+miR mimics and si-circ_0000418-2+ miR inhibitors in LN-229 and T98-G cells was examined by qPCR. B-C. CCK-8 assay (b) and BrdU experiment (c) were applied to detect the effects of circ_0000418+ miR-409-3p mimics or si-circ_0000418+ miR-409-3p inhibitor on cell growth. d. The effect of circ_0000418+ miR-409-3p mimics or si-circ_0000418+ miR-409-3p inhibitor on cell cycle was examined by flow cytometry. * P < 0.05, ** P < 0.01, *** P < 0.001.
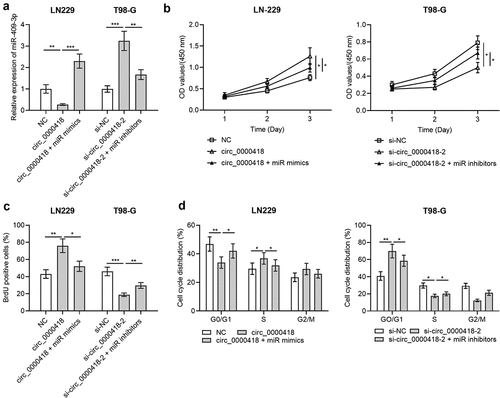
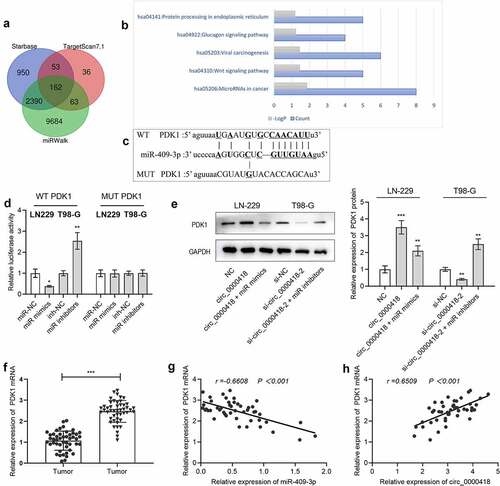
Figure 5. Circ_0000418 up-regulates PDK1 expression through adsorption of miR-409-3p a. The downstream targets of miR-409-3p were predicted through bioinformatics websites StarBase, TargetScan and miRWalk. b. Enrichment analysis of downstream target genes of miR-409-3p was conducted using the KEGG database. c. The binding site between miR-409-3p and PDK1 mRNA 3ʹUTR. d. WT PDK1 and MUT PDK1 were co-transfected with miR-409-3p mimics and miR-409-3p inhibitors into 293 T cells, and then the luciferase activity was evaluated. e. Western blot was applied to detect the effects of circ_0000418 and miR-409-3p on PDK1 expression. f. qPCR was implemented to detect PDK1 mRNA expression in 47 pairs of glioma tissues and non-cancerous brain tissues. G-H. Pearson correlation analysis was performed to analyze the correlation between circ_0000418, miR-409-3p and PDK1 mRNA expression in glioma tissues. * P < 0.05, ** P < 0.01, *** P < 0.001.