
Figures & data
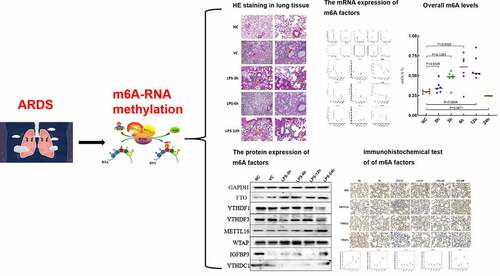
Figure 1. HE staining in lung tissue of ARDS mouse. Left and right side represent the picture with magnification × 100 and magnification × 400, respectively. In NC group, the red arrow represents macrophages; in VC group, red and green arrow represents red blood cells and neutrophils, respectively; in the LPS-3 h group, green, yellow and blue arrow represents lymphocyte, neutrophils and foam cells, respectively; in the LPS-6 h group, green arrow represents neutrophils; in the LPS-12 h group, green, yellow and red represents lymphocyte, neutrophils and macrophages, respectively.
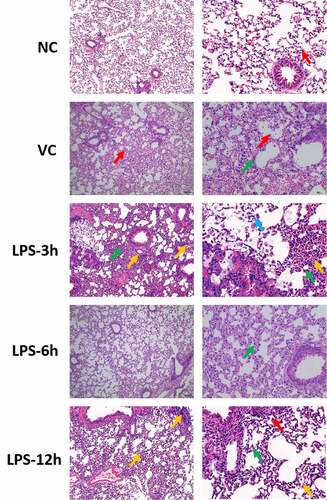
Table 1. The primer sequences of 19 m6A factors in the qRT-PCR
Figure 2. The mRNA expression of methylated transferases and demethylases in the lung tissue samples of ARDS mouse in NC, VC, LPS-3 h, LPS-6 h, LPS-12 h and LPS-24 h groups. *p < 0.05; **p < 0.01; ***p < 0.001; ****p < 0.0001.
Figure 3. The mRNA expression of recognition factors in lung tissue samples of ARDS mouse in NC, VC, LPS-3 h, LPS-6 h, LPS-12 h and LPS-24 h groups. *p < 0.05; **p < 0.01; ***p < 0.001; ****p < 0.0001.
Figure 4. Overall m6A levels in lung tissue of ARDS mouse.
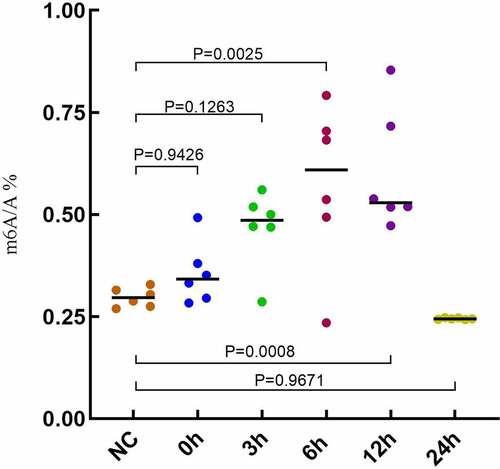
Figure 5. The protein expression of METTL16, WTAP, FTO, YTHDF1, YTHDF3, YTHDC1 and IGFBP3 in the lung tissue samples of ARDS mouse in NC, VC, LPS-3 h, LPS-6 h, LPS-12 h and LPS-24 h groups.
Figure 6. Immunohistochemical tests of FTO, METTL16, YTHDC1, YTHDF1 and YTHDF3 in right lung tissue of ARDS mouse. Magnification: 400 ×.
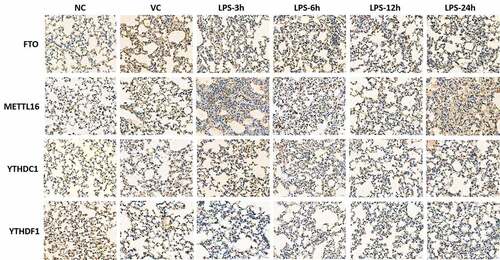
Figure 7. Immunohistochemical quantitative results of FTO, METTL16, YTHDC1, YTHDF1 and YTHDF3 in right lung tissue of ARDS mouse. *p < 0.05; **p < 0.01; ***p < 0.001; ****p < 0.0001.
Supplemental Material
Download TIFF Image (279 KB)Data availability statement
All data are available in the article.