Figures & data
Table 1. The baseline characteristics of all participants
Figure 1. The composition of intestinal flora and the comparison of microbial relative abundance. Pie chart of the dominant phylum-level intestinal flora in healthy subjects and patients with meningioma and glioma (a). The comparison of relative abundance of gut microbiome at the family level (b), and genus level (c) of the three groups. †H: healthy group. M: benign meningioma group. G: malignant glioma group.
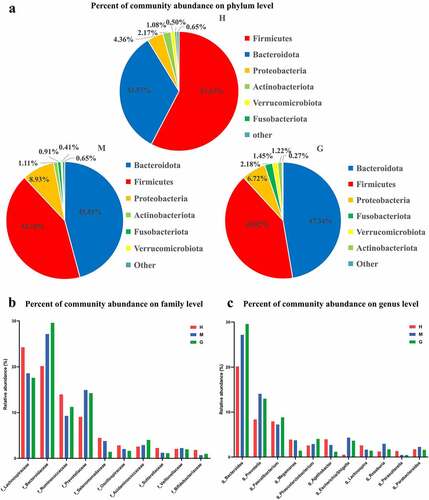
Figure 2. The alpha and beta diversity of the intestinal flora in healthy subjects and patients with meningioma and glioma. Boxplot of alpha diversity indices, including Shannon (a), Simpson (b), and Chao1 (c) indices. Principal coordinate analysis (PCoA) plot based on unweighted UniFrac distances (A). The horizontal and vertical axes represent the first and second principal coordinates, which explains the greatest proportion of variance to the microbial communities. Each spot represents a sample, and each color represents a group. * 0.01 < p < 0.05; ** p < 0.01; Non-metric Multidimensional Scaling (NMDS) based on Bray-Curtis distances (B). Each spot represents one sample, and each color represents one group. The samples with high similarity of gut microbiome compositions present a close distance in spots. The analysis of similarities (ANOSIM) in healthy subjects and patients with meningioma and glioma (C). The result shows the differences in the inter-group to be significantly greater than in the intra-group (R = 0.109, p = 0.001). †H: healthy group. M: benign meningioma group. G: malignant glioma group.
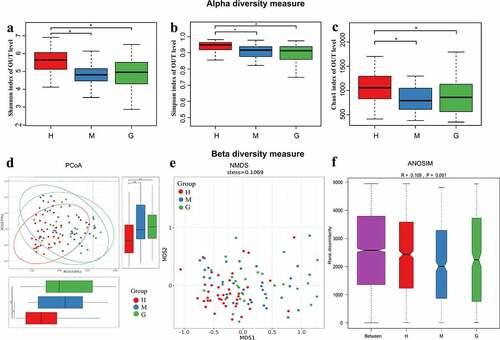
Figure 3. Linear discriminant analysis (LDA) coupled with effect size (LEfSe). Cladogram suggests enriched taxa in intestinal flora of the healthy subjects and patients with meningioma and glioma (a). The LDA scores of different microbial taxa in healthy subjects and patients with meningioma and glioma (b). The radiations from inside to outside indicate the taxonomic levels from phylum to genus. One node indicates one species classification at that level. The yellow node suggests that the species was not different between groups, and nodes in other colors suggest that the species was enriched in the corresponding group. Only taxa with an LDA value greater than 2 are displayed. †H: healthy group. M: benign meningioma group. G: malignant glioma group.
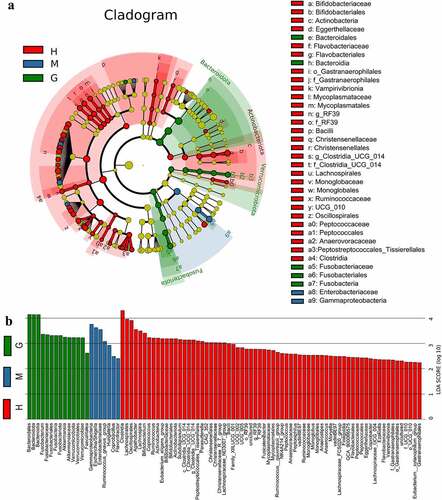
Figure 4. The different genera as biomarkers for brain tumors. The relative abundance of different genera, including Fusobacterium (a), Akkermansia (b), Escherichia/Shigella (c), Lachnospira (d), Agathobacter (e), and Bifidobacterium (f) per sample. ROC curves were calculated to distinguish patients with brain tumors and patients in the healthy group according to the six genera, either individually or combined (g). †ROC: receiver operating characteristic; AUC: area under the receiver operating characteristic curve. H: healthy group. M: benign meningioma group. G: malignant glioma group. c: class; o: order; f: family; g: genus.
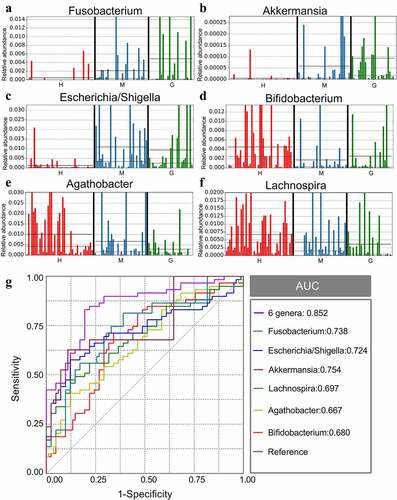
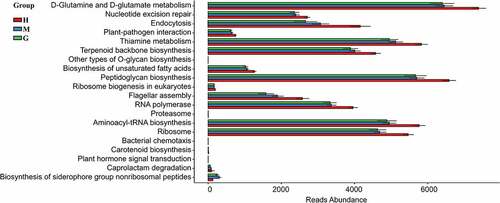
Figure 5. Functional predictions in the intestinal flora of healthy subjects and patients with meningioma and glioma. The top 20 significantly different KEGG pathways among the groups were determined using PICRUSt (p < 0.05). †KEGG: Kyoto Encyclopedia of Genes and Genomes. PICRUSt: Phylogenetic Investigation of Communities by Reconstruction of Unobserved States. H: healthy group. M: benign meningioma group. G: malignant glioma group.