Figures & data
Figure 1. The expression of miR-30e-5p was descending not only in PCa tissues but also in other pan-gastrointestinal cancers tissues except for COAD, compared to normal tissues. (A) qRT-PCR analysis of miR-30e-5p expression in 48 paired PCa tissues (cancer) and adjacent non-cancer tissues (adjacent). (B-F) miR-30e-5p expression in PAAD, ESCA, STAD, LIHC, COAD cancer and adjacent normal tissues based on TCGA miRNA-seq. ***p < 0.001; **p < 0.01; *p < 0.05. Abbreviations: PCa: pancreatic cancer; PAAD: Pancreatic adenocarcinoma; ESCA: Esophageal carcinoma; STAD: Stomach adenocarcinoma; LIHC: Liver hepatocellular carcinoma; COAD: Colon adenocarcinoma.
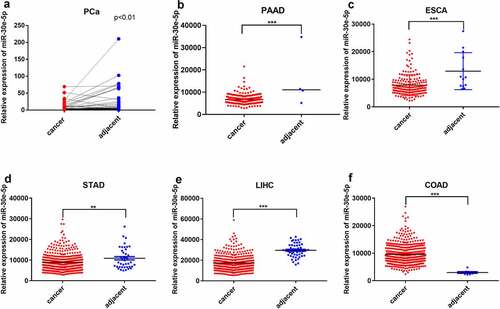
Figure 2. miR-30e-5p could impede PCa cell proliferation. (A, B) Fluorescence expression levels of BxPC-3 and PANC-1 cells transfected with the NC and miR-30e-5p mimics and miR-30e-5p inhibitor in each group. (C, D) miR-30e-5p expression levels of BxPC-3 and PANC-1 cells in each group by qRT-PCR. (E, F) Cell viability of BxPC-3 and PANC-1cells in each group after transfection with miR-30e-5p. (G-J) Number of clone formation of BxPC-3 and PANC-1cells in each group. ***p < 0.001; **p < 0.01; *p < 0.05. Magnification: 100X.
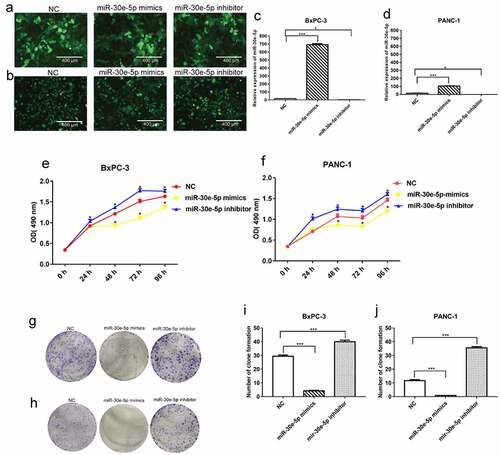
Figure 3. miR-30e-5p could promote PCa cell apoptosis. (A) Flow cytometry of BxPC-3 cells in each group. (B) Flow cytometry of PANC-1 cells in each group. (C) Histogram of apoptosis rate of BxPC-3 cells in each group. (D) Histogram of apoptosis rate of PANC-1 cells in each group. The apoptosis was detected 48 hours after transfection, respectively. ***p < 0.001; **p < 0.01; *p < 0.05.
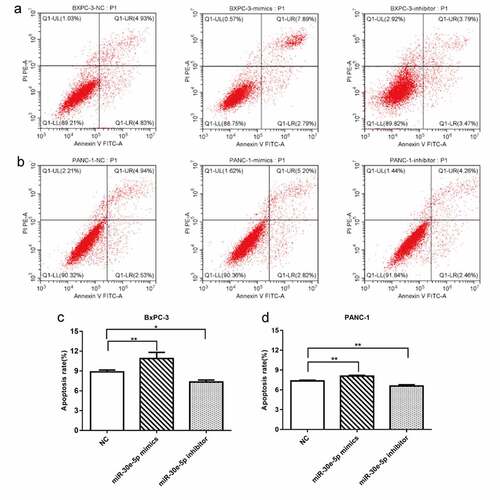
Figure 4. miR-30e-5p could represse PCa cells migration and invasion. (A, B) Micrographs of migration distance of BxPC-3 and PANC-1 cells in each group. (C, D) Histogram of migration ratio of BxPC-3 and PANC-1 cells in each group. The migration distance was detected 48 hours after transfection, respectively. (E, F) Micrographs of the number of BxPC-3 cells and PANC-1 cells that passing through the stromal membrane in each group. (G, H) Histogram of the number of BxPC-3 cells and PANC-1 cells that passing through the stromal membrane in each group. The number of cells crossing the stromal membrane was detected 48 hours after transfection, respectively. ***p < 0.001; **p < 0.01; *p < 0.05. Magnification: 100X.
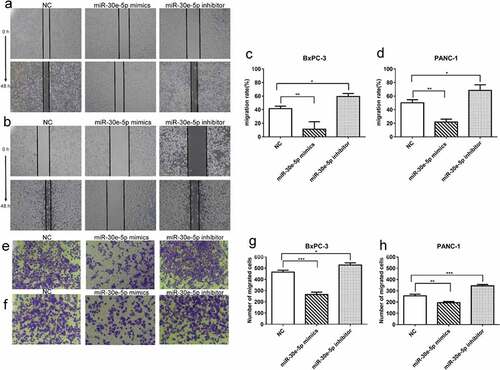
Figure 5. Functional annotation for differential expressed genes. (A) Volcano plot of DEGs from comparison between miR-30e-5p mimics and NC groups. (B) Volcano plot of DEGs from comparison between miR-30e-5p inhibitor and NC groups. (C) GO terms for DEGs in miR-30e-5p mimics group; (D) GO terms for DEGs in miR-30e-5p inhibitor group.
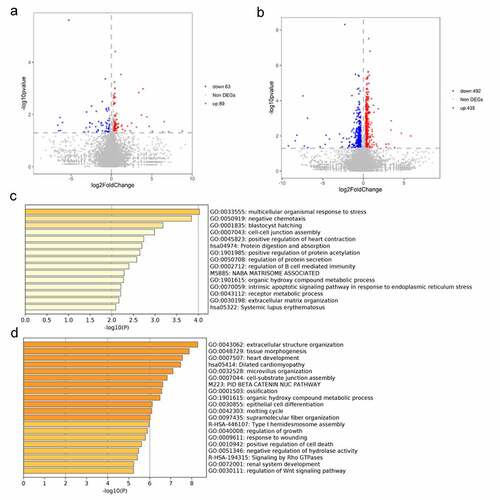
Figure 6. SNAI1 was identified as a target gene of miR-30e-5p in PCa. (A) Bioinformatic analysis for predicting binding sites of miR-30e-5p in SNAI1 by Targetscan website. (B) Luciferase assay for luciferase reporters with wild-type or mutant SNAI1 3’ UTR relative to Renilla luciferase activity in 293T cells transiently transfected with the negative control and miR-30e-5p mimic. (C, D) The SNAI1 expression levels of BxPC-3 and PANC-1 cells in each group. ***p < 0.001; **p < 0.01; *p < 0.05. ns: no significance.
Figure 7. SNAI1 participated in miR-30e-5p-mediated cell proliferation. (A, B) Cell viability of BxPC-3 and PANC-1cells in each group after infected with OE-SNAI1 lentivirus and co-transfected with miR-30e-5p. (C-F) Number of clone formation of BxPC-3 and PANC-1cells in each group after infected with OE-SNAI1 lentivirus and co-transfected with miR-30e-5p. ***p < 0.001; **p < 0.01; *p < 0.05. Magnification: 100X. Abbreviations: OE: Over Expressed.
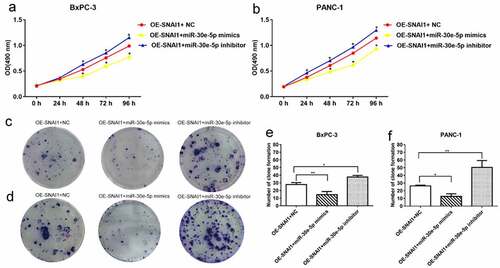
Figure 8. SNAI1 participated in miR-30e-5p-mediated cell apoptosis. (A, B) Flow cytometry of BxPC-3 and PANC-1 cells in each group. (C, D) Histogram of apoptosis rate of BxPC-3 cells and PANC-1 in each group. The apoptosis was detected 48 hours after co-transfection, respectively. ***p < 0.001; **p < 0.01; *p < 0.05.
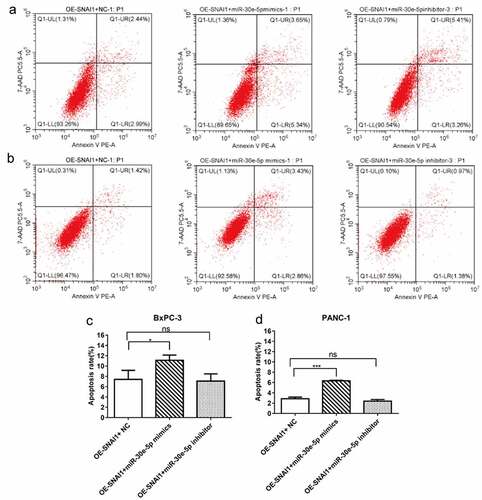
Figure 9. SNAI1 participated in miR-30e-5p-mediated cell migration and invasion. (A, B) Micrographs of migration distance of BxPC-3 and PANC-1 cells in each group. (C, D) Histogram of migration ratio of BxPC-3 and PANC-1 cells in each group. The migration distance was detected 48 hours after co-transfection, respectively. (E, F) Micrographs of the number of BxPC-3 and PANC-1 cells that passing through the stromal membrane in each group. (G, H) Histogram of the number of BxPC-3 and PANC-1 cells that passing through the stromal membrane in each group. The number of cells crossing the stromal membrane was detected 48 hours after co-transfection, respectively. Magnification: 100X.
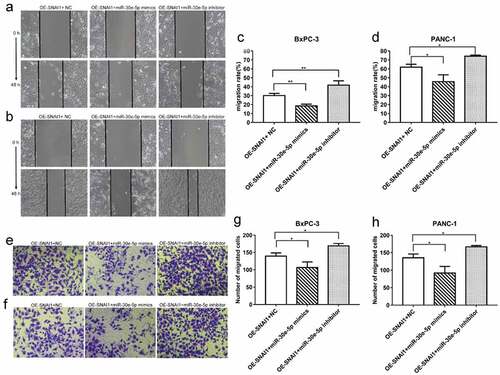
Figure 10. miR-30e-5p could influence the expressions of SNAI-mediated EMT pathway related proteins in PCa. (A, B) Image of western blotting of target proteins (E-cadherin, N-cadherin, SNAI1 and MMP-9) in BxPC-3 and PANC-1 cells in each group after transfection with miR-30e-5p; (C, D) Histogram of relative protein expression levels of target proteins in BxPC-3 and PANC-1 cells in each group. ***p < 0.001; **p < 0.01; *p < 0.05. ns: no significance. EMT: epithelial-mesenchymal transition.
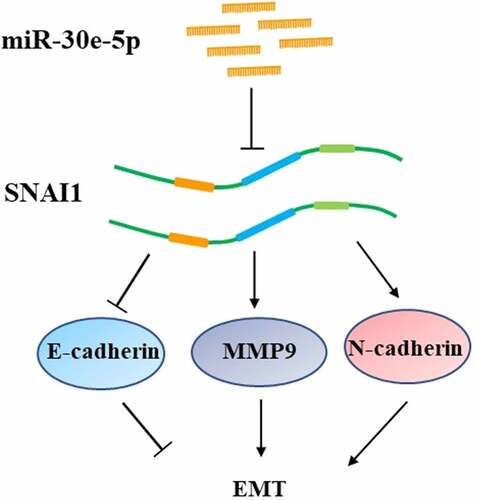
Figure 11. A schematic model of miR-30e-5p targeting SNAI1 to regulate EMT on pancreatic cancer.