
Figures & data
Figure 1. Montelukast prevented pemetrexed-induced cell viability and release of LDH in human LO-2 hepatocytes. Cells were incubated with pemetrexed (250 nM) and Montelukast (5, 10 μM) for 24 h. Cell viability and release of LDH was measured (####, P < 0.0001 vs. vehicle; **, ***, P < 0.01, 0.001 vs. pemetrexed treatment group).
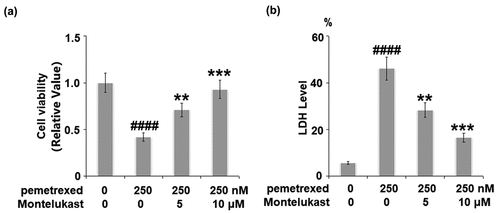
Figure 2. Montelukast ameliorated pemetrexed-induced oxidative stress. (a). Mitochondrial ROS; (b). The level of reduced GSH (####, P < 0.0001 vs. vehicle group; **, ***, P < 0.01, 0.001 vs. pemetrexed treatment group).
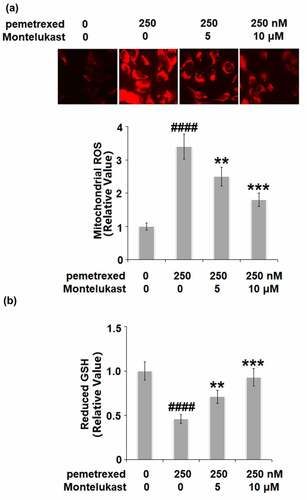
Figure 3. Montelukast reduced pemetrexed-induced expression of NOX-4. (a). mRNA of NOX-4; (b). Protein of NOX-4 (####, P < 0.0001 vs. vehicle; **, ***, P < 0.01, 0.001 vs. pemetrexed treatment group).
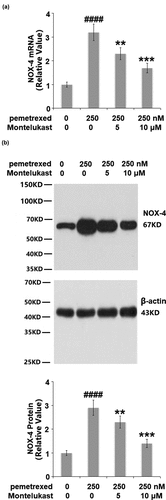
Figure 4. Montelukast suppressed pemetrexed-induced activation of NLRP3. (a). mRNA level of NLRP3; (b). Protein level of NLRP3 (####, P < 0.0001 vs. vehicle; **, ***, P < 0.01, 0.001 vs. pemetrexed treatment group).
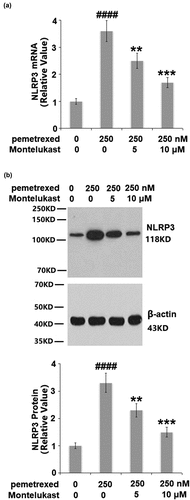
Figure 5. Montelukast suppressed pemetrexed-induced secretion of IL-1β and IL-18. (a). Secretions of IL-1β; (b). Secretions of IL-18 (####, P < 0.0001 vs. vehicle group; **, ***, P < 0.01, 0.001 vs. pemetrexed treatment group).
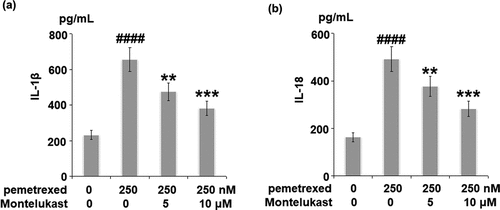
Figure 6. Montelukast inhibited pemetrexed-induced eukaryotic initiation factor-2α (eIF-2α)/ATF4. The expressions of p-eIF-2α and ATF4 (####, P < 0.0001 vs. vehicle group; **, ***, P < 0.01, 0.001 vs. pemetrexed treatment group).
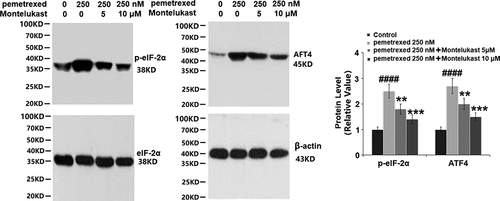
Figure 7. Montelukast prevented pemetrexed–induced expression of GADD34 and CHOP.(a). mRNA of GADD34 and CHOP; (b). Protein of GADD34 and CHOP (####, P < 0.0001 vs. vehicle group; **, ***, P < 0.01, 0.001 vs. pemetrexed treatment group).
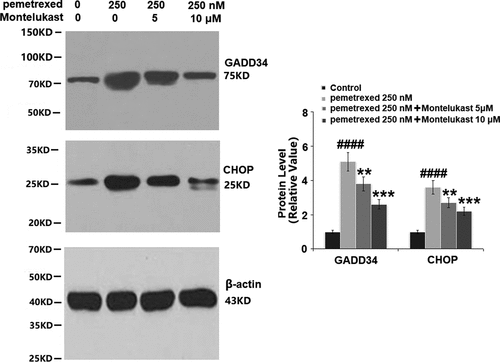
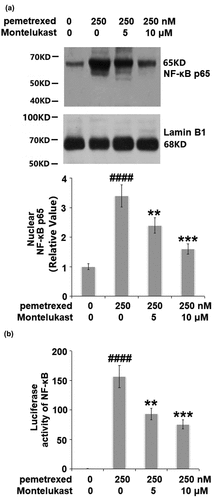
Figure 8. Montelukast suppressed the activation of NF-κB.(a). Nuclear levels of NF-κB p65; (b). Luciferase activity of NF-κB (####, P < 0.0001 vs. vehicle group; **, ***, P < 0.01, 0.001 vs. pemetrexed treatment group).
Data availability statement
Requests for data and materials should be addressed to the corresponding author