Figures & data
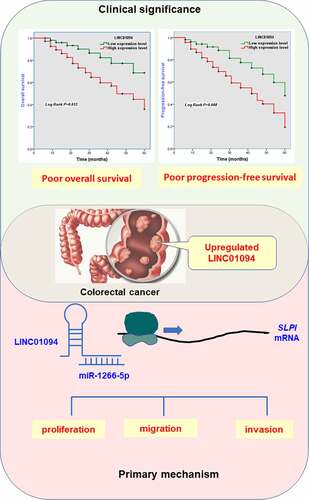
Figure 1. LINC01094 level was upregulated in colorectal cancer tissues and cells. (a). Box plots of the LINC01094 expression levels in adjacent normal tissue (ANT) and colorectal cancer tissues (CRC) by RT-qPCR. (b). Boxplots of the LINC01094 expression levels in colon normal epithelial cell FHC and colorectal cancer cells, SW480, SW620, LoVo, HCT116, and SW1463 by RT-qPCR. ***P < 0.001.
Table 1. Key characteristics and their association with clinical LINC01094 expression in patients with colorectal cancer
Table 2. Multivariate analyses of risk factors for cumulative overall survival in colorectal cancer patients
Figure 2. Survival estimates were calculated by Kaplan-Meier analysis and compared with the log-rank test for LINC01094 in colorectal cancer. (a). Patients with high LINC01094 expression had a shorter overall survival time than those with low LINC01094 levels. Log-rank test P = 0.012. (b). Patients with high LINC01094 expression represented a shorter progression-free survival time than those with low LINC01094 levels. Log-rank test P = 0.008.
Figure 3. Downregulation of LINC01094 impeded the malignant biological behavior of CRC cells while overexpression hastened that. (a). Overexpression of LINC01094 was achieved by transfection of oe-LINC01094, and downregulation of LINC01094 by transfection of si-LINC01094 in SW620 cells. (b-d). Overexpression of LINC01094 promoted cell proliferation, migration and invasion, while downregulation of LINC01094 impeded the biological behavior of SW620 cells compared with the respective negative control. (e). Overexpression of LINC01094 was achieved by transfection of oe-LINC01094, and downregulation of LINC01094 by transfection of si-LINC01094 in LoVo cells. (f-h). Overexpression of LINC01094 promoted cell proliferation, migration, and invasion, while downregulation of LINC01094 impeded those biological behaviors of LoVo cells compared with the respective negative control. *P < 0.05, **P < 0.01, ***P < 0.001 (oe-LINC01094 vs. oe-NC). ##P < 0.01, ###P < 0.001 (si-LINC01094 vs. si-NC).
Figure 4. LINC01094 is a sponge of miR-1266-5p. (a). LINC01094 was mainly a cytoplasmic-localized lncRNA by the nuclear/cytoplasmic extraction assay. (b). Prediction of binding sequences involving LINC01094 3’-UTR and miR-1266-5p. (c). Boxplots of the miR-1266-5p expression levels in adjacent normal tissue (ANT) and colorectal cancer tissues (CRC) by RT-qPCR. (d). Correlation between the LINC01094 and miR-1266-5p expression levels analyzed by Pearson r analysis. (e). Overexpression of LINC01094 caused a reduction of miR-1266-5p expression level in SW620 cells, whereas knockdown of LINC01094 increased the level of miR-1266-5p. (f). Detection of relative expression of miRNAs by RT-qPCR in RNA pull-down assay by different biotinylated RNAs. (f). The results of dual-luciferase reporter assay in SW620 cells. **P < 0.01.
Figure 5. Dynamic effects of LINC01094 and its target miR-1266-5p on CRC cell proliferation, migration and invasion. SW620 cells were co-transfected with si-LINC01094 and anti-miR-1266-5p. (a). Transfection efficiency was detected by RT-qPCR. (b). Cell viability was examined by MTT assay. (c). Cell migratory capacity was examined by Costar Transwell inserts (Corning, USA). (d). Cell invasive capacity was examined by Matrigel Invasion Chambers. *P < 0.05, **P < 0.01, ***P < 0.001, compared to the si-NC+anti-miR-con group; ##P < 0.01, ###P < 0.001, compared to the si-NC+anti-miR-1266-5p group.
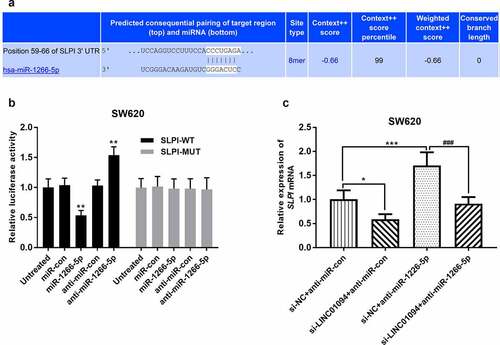
Figure 6. miR-1266-5p binds to the SLPI 3’-UTR. (a). The potential binding sites of miR-1266-5p in SLPI 3’-UTR. (b). Luciferase reporter assays were performed by constructing luciferase reporter vectors to validate the predicted binding of miR-590-3p to the SLPI 3’-UTR. **P < 0.01, ***P < 0.001, compared to the untreated group; (c). Dynamic effects of LINC01094 and its target miR-1266-5p on expression of SLPI mRNA. *P < 0.05, ***P < 0.001, compared to the si-NC+anti-miR-con group; ###P < 0.001, compared to the si-NC+anti-miR-1266-5p group.