
Figures & data
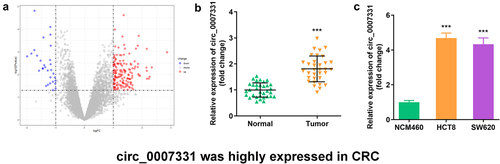
Figure 1. Circ_0007331 was elevated in CRC. (a) Volcano plots indicated the differentially expressed circRNAs between CRC and normal samples. (b) circ_0007331 expression in CRC patients. (c) circ_0007331 expression in HCT8 as well as SW620 cells.
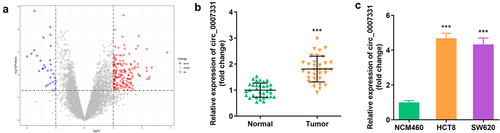
Figure 2. Circ_0007331 knockdown declined aggressiveness of CRC cells. (a) Expression of circ_0007331 in HCT8 as well as SW620 cells. (b) Cell viability of HCT8 as well as SW620 cells. (c, d) Clone formation of HCT8 as well as SW620 cells. (e, f) The migration of CRC cells. (g, h) The invasion of CRC cells. (i) The protein expression of N-cadherin and E-cadherin. *** P < 0.001 versus si-nc.
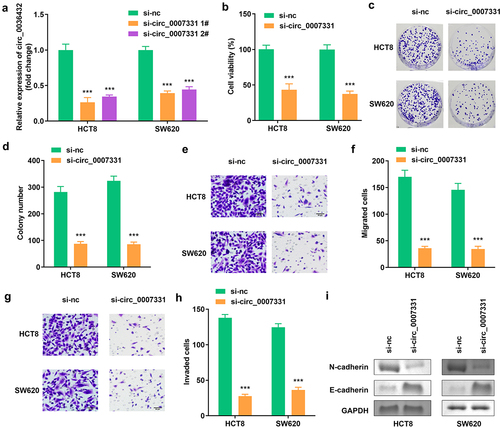
Figure 3. Circ_0007331 directly targeted miR-205-5p (a) The binding sites between circ_0007331 and miR-205-5p. (b, c) The luciferase activity of HCT8 and SW620 cells. (d, e) The interaction between circ_0007331 and miR-205-5p. (f) miR-205-5p expression in HCT8 and SW620 cells. (g) miR-205-5p expression in cells with circ_0007331 knockdown. **P < 0.01, *** P < 0.001 versus control.
Figure 4. miR-205-5p inhibition reversed the effects of circ_0007331 knockdown. (a) Expression of circ_0007331 in HCT8 as well as SW620 cells. (b) Cell viability of HCT8 as well as SW620 cells. (c, d) Clone formation of HCT8 as well as SW620 cells. (e, f) The migration of CRC cells. (g, h) The invasion of CRC cells. (i) The protein expression of N-cadherin and E-cadherin. #P < 0.05, ##P < 0.01, **P < 0.01, *** P < 0.001 versus control.
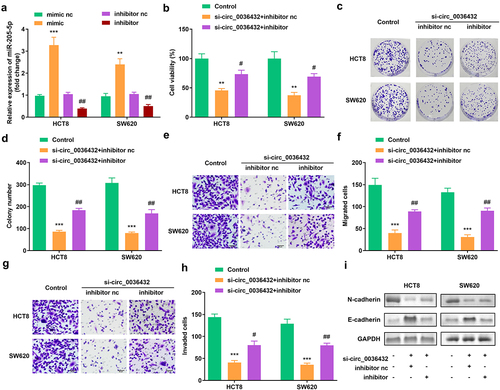
Figure 5. miR-205-5p directly targeted HMGA2 (a) The binding sites between HMGA2 and miR-205-5p. (b, c) The luciferase activity of HCT8 and SW620 cells. (d, e) The interaction between HMGA2 as well as miR-205-5p. (f) Expression of HMGA2 in HCT8 and SW620 cells. (g) Expression of HMGA2 in cells with miR-205-5p overexpression. **P < 0.01, *** P < 0.001 versus control.
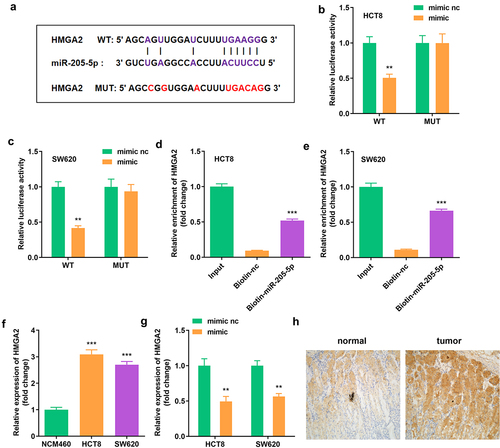
Figure 6. Elevated HMGA2 neutralized the function of miR-205-5p on cell viability, colony formation, migration as well as invasion (a) HMGA2 expression in HCT8 as well as SW620 cells. (b) Cell viability of HCT8 as well as SW620 cells. (c, d) Clone formation of HCT8 as well as SW620 cells. (e, f) The migration of CRC cells. (g, h) The invasion of CRC cells. (i) The protein expression of N-cadherin and E-cadherin. #P < 0.05, ##P < 0.01, **P < 0.01, *** P < 0.001 versus control.
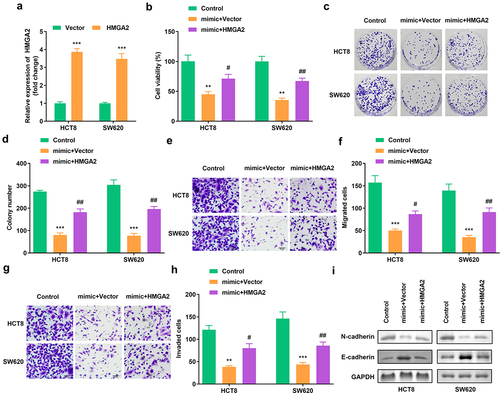
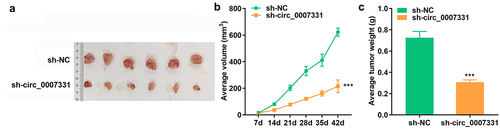
Figure 7. Depletion of circ_0007331 suppressed tumor growth in vivo representative images (a), tumor volume (b) and tumor weight (c) of tumors derived from xenograft models. *** P < 0.001 versus sh-NC.graphical abstract.
Data availability statement
Not applicable.