
Figures & data
Figure 1. LPS triggered the FoxO1-AQP5 pathway in microglia and astrocytes. (a) and (b) WB examined the expression of FoxO1 and the downstream AQP5 and ERK/p38 MAPK signaling pathways in microglia and astrocytes induced with and without LPS. Data are presented as mean ± SEM (n = 3). **P < 0.01, ***P < 0.001 (vs. Con group).
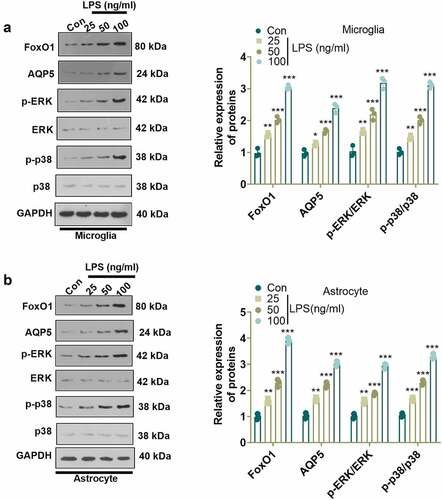
Figure 2. Inhibition of FoxO1 or AQP5 abated LPS-induced production of inflammatory factors in cells.
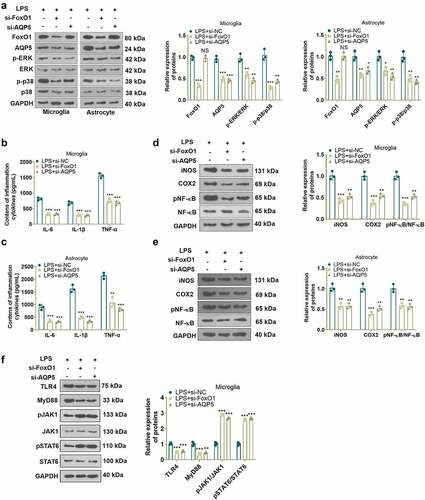
Figure 3. CCI rats experienced NP, accompanied by increased inflammatory factors in spinal cord tissues. (a) and (b) PWT and PWL in CCI rats 1, 3, 7, 14 and 21 days after CCI. (c-f) IHC was employed to analyze iBA1-, GFAP-, and Caspase3-positive cells in microglia and astrocytes. (g) The expression of neutron IL-6, IL-1β and TNF-α in spinal cord tissues of CCI rats at 1, 7, and 21 days after operation was gauged by ELISA. (h) The levels of iNOS, COX2 and p-NF-κB in the spinal cord of CCI rats were measured by WB at 1, 7, and 21 days after the operation. Data are expressed as mean ±SEM (n = 5). **P < 0.01, ***P < 0.001 (vs Sham group).
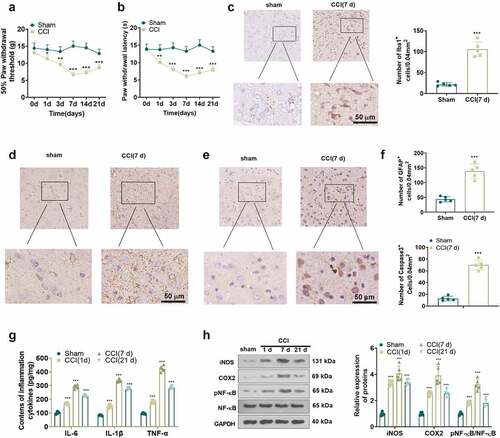
Figure 4. FoxO1-AQP5 was up-regulated in spinal cord tissues of CCI rats. (a) WB assayed the expression of FoxO1, AQP5, p-ERK and p-p38 in the spinal cord tissue of CCI rats at 1, 7, and 21 days postoperatively. Data are expressed as mean ± SEM (n = 5). ***P < 0.001 (vs. Sham group).
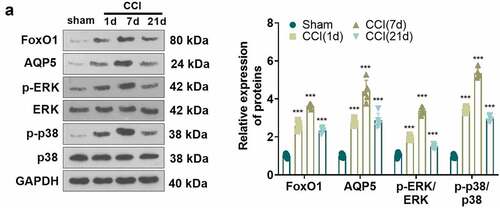
Figure 5. Inhibition of FoxO1 attenuated nerve pain and inflammatory cytokine production in the spinal cord in CCI rats.
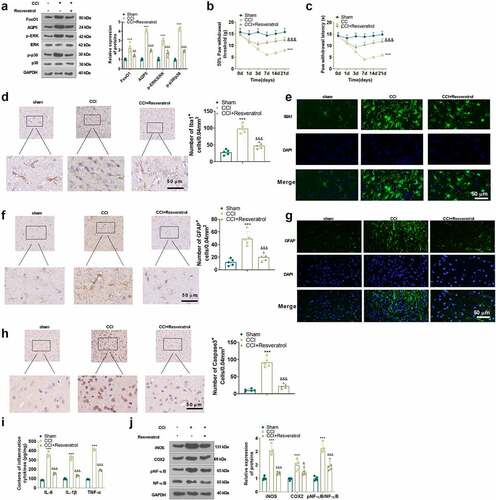
Figure 6. The mechanism’s diagram.
