
Figures & data
Table 1. Primer sequences used for RT-qPCR
Figure 1. Circ_0017639 was overexpressed in DDP-resistant NSCLC samples and cells. (a) Heatmap exhibited 12 significantly upregulated circRNAs in NSCLC samples with respect to matching adjacent normal samples (GSE112214 microarray). (b) A diagram exhibited the level of circ_0017639 in NSCLC samples and 3 matching adjacent normal samples (GSE112214). (c and d) RT-qPCR analysis of circ_0017639 in 41 NSCLC samples (with respect to adjacent normal samples) and 4 NSCLC cell lines (with respect to HBE cells). (e) RT-qPCR analysis of circ_0017639 in 21 DDP-resistant NSCLC samples and 20 NSCLC DDP-sensitive NSCLC samples. (f-h) Analysis of the IC50 value of DDP-resistant NSCLC cells and their parental cells by MTT assay. (i) Assessment of circ_0017639 in NSCLC cells (compared with HBE cells) and DDP-resistant NSCLC cells (compared with their parental cells) by RT-qPCR. (j and k) The circular structure of circ_0017639 in DDP-resistant NSCLC cells was verified by RNase R treatment and RT-qPCR analysis. (l and m) Subcellular fractionation assay was carried out to analyze the cellular distribution of circ_0017639 in DDP-resistant NSCLC cells. *P < 0.05, **P < 0.01, ***P < 0.001, and ****P < 0.0001.
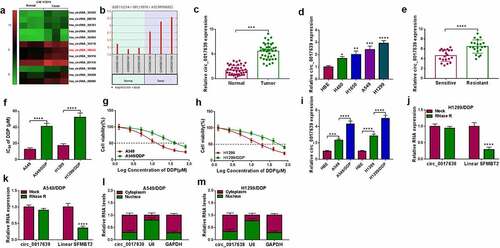
Figure 2. Influence of circ_0017639 inhibition on the sensitivity and malignancy of DDP-resistant NSCLC cells. (a) RT-qPCR analysis of circ_0017639 in DDP-resistant NSCLC cells transfected with si-circ_0017639 or si-NC. (b and c) MTT assay assessed the IC50 value and viability of circ_0017639-inhibiting DDP-resistant NSCLC cells and control cells. (d-h) The colony formation, proliferation, apoptosis, invasion, and migration of circ_0017639-inhibiting DDP-resistant NSCLC cells and control cells were analyzed by colony formation, EDU, flow cytometry, transwell invasion, and wound-healing assays. (i and j) Western blotting detected MMP9 and Cleaved-caspase-3 protein levels in DDP-resistant NSCLC cells transfected with si-circ_0017639 or si-NC. **P < 0.01, ***P < 0.001, and ****P < 0.0001.
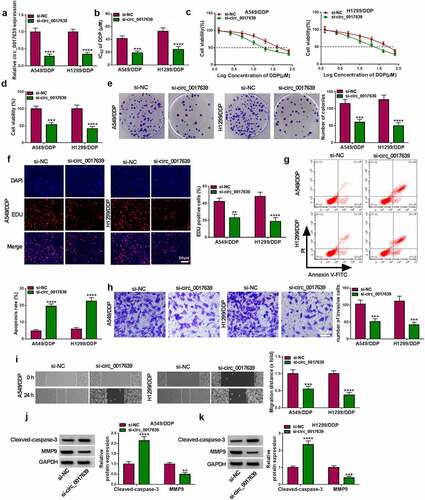
Figure 3. Identification of circ_0017639 as a miR-1296-5p sponge. (a) Schematic illustrating the sequence alignment of circ_0017639 with miR-1296-5p. (b) Analysis of miR-1296-5p in DDP-resistant NSCLC cells with miR-1296-5p mimic or miR-NC. (c and d) Dual-luciferase reporter assay analysis of the luciferase activities of WT-circ_0017639 and MUT-circ_0017639 plasmids in the presence of miR-1296-5p mimic or miR-NC in DDP-resistant NSCLC cells. (e) Expression of miR-1296-5p in 21 DDP-resistant NSCLC samples and 20 NSCLC DDP-sensitive NSCLC samples was analyzed by RT-qPCR. (f) Pearson’s correlation analysis uncovered the correlation between miR-1296-5p and circ_0017639 in DDP-resistant NSCLC samples. (g) RT-qPCR analysis of miR-1296-5p in DDP-resistant NSCLC cells (in contrast to their parent cells) and NSCLC cells (in contrast to HBE cells). (h) RT-qPCR analysis of circ_0017639 in DDP-resistant NSCLC cells with circ_0017639 or pCD5-ciR. (i) Effects of circ_0017639 inhibition and overexpression on miR-1296-5p expression in DDP-resistant NSCLC cells. **P < 0.01, ***P < 0.001, and ****P < 0.0001.
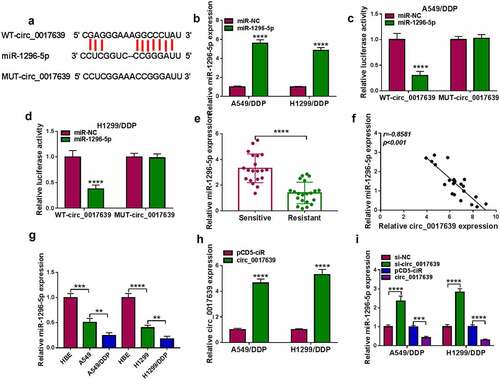
Figure 4. Circ_0017639 sponged miR-1296-5p to regulate DDP-resistant NSCLC cell sensitivity and malignancy. (a) Analysis of miR-1296-5p in DDP-resistant NSCLC cells transfected with anti-miR-NC or anti-miR-1296-5p by RT-qPCR. (b) Influence of miR-1296-5p inhibitor on miR-1296-5p in circ_0017639-inhibiting DDP-resistant NSCLC cells. (c and d) Effects of miR-1296-5p silencing on the IC50 value and viability of circ_0017639-inhibiting DDP-resistant NSCLC cells were assessed by MTT assay. (e-i) Impacts of miR-1296-5p knockdown on colony formation, proliferation, apoptosis, invasion, and migration of circ_0017639-inhibiting DDP-resistant NSCLC cells were analyzed by colony formation, EDU, flow cytometry, transwell invasion, and wound-healing assays. (j and k) Influence of miR-1296-5p silencing on MMP9 and Cleaved-caspase-3 protein levels in circ_0017639-inhibiting DDP-resistant NSCLC cells. *P < 0.05, **P < 0.01, ***P < 0.001, and ****P < 0.0001.
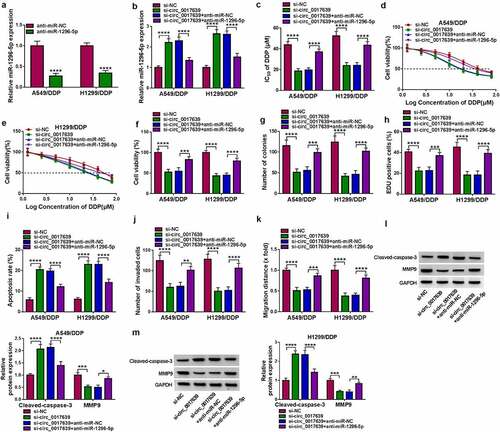
Figure 5. SIX1 as a miR-1296-5p target was verified. (a) Schematic illustrating the sequence alignment of SIX1 3’UTR with miR-1296-5p. (b and c) Dual-luciferase reporter assay assessed the luciferase activity of MUT-SIX1 3’UTR and MUT-SIX1 3’UTR plasmids in DDP-resistant NSCLC cells transfected with miR-1296-5p mimic or miR-NC. (d) The level of SIX1 mRNA in NSCLC through consulting the GEPIA database. (e) Analysis of SIX1 mRNA in 21 DDP-resistant NSCLC samples and 20 DDP-sensitive NSCLC samples by RT-qPCR. (f) Correlation of SIX1 mRNA and miR-1296-5p in DDP-resistant NSCLC samples was analyzed by Pearson’s correlation analysis. (g and h) Protein level of SIX1 in DDP-resistant NSCLC tissues, NSCLC cells, and DDP-resistant NSCLC cells was detected. (i) Impacts of miR-1296-5p mimic and inhibitor on SIX1 protein levels in DDP-resistant NSCLC cells. ***P < 0.001 and ****P < 0.0001.
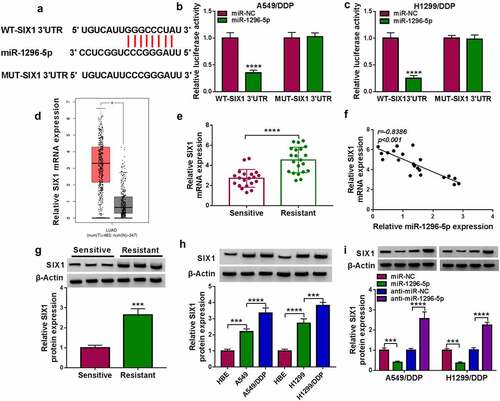
Figure 6. MiR-1296-5p decreased DDP-resistant NSCLC cell resistance and malignancy via targeting SIX1. (a) After SIX1 or pcDNA transfection, the SIX1 protein level was analyzed. (b) Influence of SIX1 introduction on the SIX1 protein level in miR-1296-5p-overexpressed DDP-resistant NSCLC cells was evaluated using western blotting. (c and d) Influence of SIX1 overexpression on the IC50 value and viability of miR-1296-5p-elevated DDP-resistant NSCLC cells was evaluated by MTT assay. (e-i) Impacts of SIX1 upregulation on colony formation, proliferation, apoptosis, invasion, and migration of miR-1296-5p-overexpressed DDP-resistant NSCLC cells were analyzed by colony formation, EDU, flow cytometry, transwell invasion, and wound-healing assays. (j and k) Effects of SIX1 upregulation on protein levels of MMP9 and Cleaved-caspase-3 in miR-1296-5p-overexpressed DDP-resistant NSCLC cells were evaluated by western blotting. **P < 0.01, ***P < 0.001, and ****P < 0.0001.
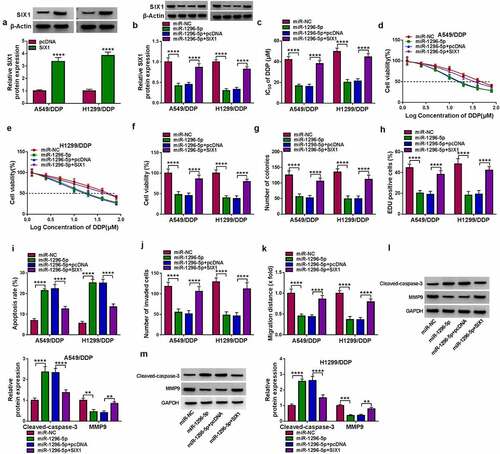
Figure 7. Circ_0017639 regulated SIX1 expression via adsorbing miR-1296-5p. (a and b) Analysis of SIX1 at mRNA and protein levels in DDP-resistant NSCLC cells transfected with si-NC, si-circ_0017639, si-circ_0017639+ anti-miR-NC, or si-circ_0017639+ anti-miR-1296-5p by RT-qPCR or western blotting. **P < 0.01, ***P < 0.001, and ****P < 0.0001.
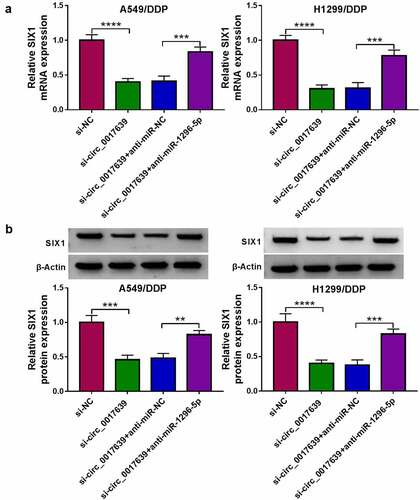
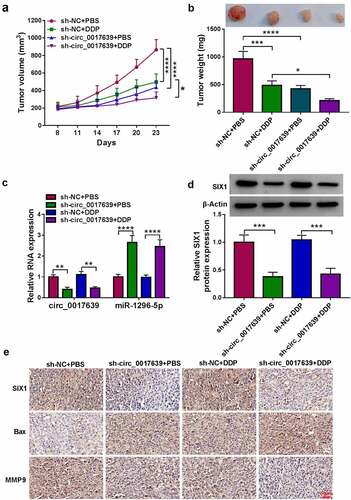
Figure 8. Knockdown of circ_0017639 decreased xenograft tumor growth and sensitized cells to DDP in vivo. (a and b) The average tumor volume and weight of mice in sh-NC+PBS, sh-circ_0017639+ PBS, sh-NC+DDP, sh-circ_0017639+ DDP groups. (c and d) Analysis of circ_0017639, miR-1296-5p, and SIX1 protein in xenograft tumors in the above groups was done. (e) Analysis of SIX1 in xenograft tumors in the above groups by IHC. *P < 0.05, **P < 0.01, ***P < 0.001, and ****P < 0.0001.
Supplemental Material
Download Zip (2.5 MB)Data Availability Statement
No new data were generated or analyzed in support of this research.