
Figures & data
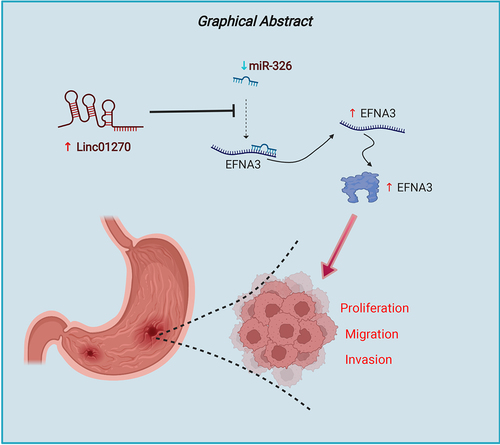
Figure 1. LINC01270 expression was up-regulated in GC.
(a) The expression of LINC01270 was examined in GC tissues and normal adjacent tissues through RT-qPCR. (b) The expression of LINC01270 was measured in gastric epithelial cell (GES-1) and GC cell lines (HGC-27, AGS, and SGC-7901) through RT-qPCR. (c) The location of LINC01270 in tumor tissues or normal tissues was verified through RNA-FISH. ***p < 0.001.
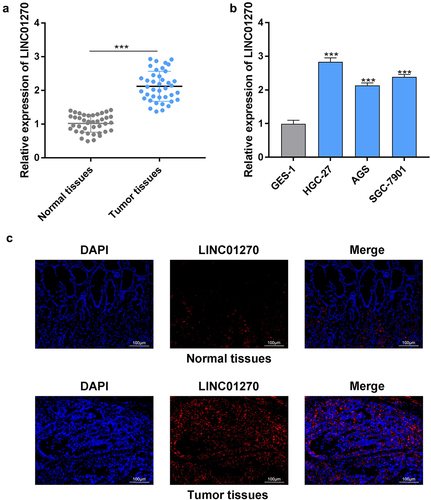
Figure 2. LINC01270 knockdown retarded GC progression.
(a) The knockdown efficiency of LINC01270 was verified in the sh-NC, sh-LINC01270#1, sh-LINC01270#2, and sh-LINC01270#3 groups through RT-qPCR. (b) The cell viability was detected after silencing LINC01270 through CCK-8 assay. (c) The cell proliferation was measured after silencing LINC01270 through colony formation assay. (d and e) The cell migration and invasion abilities were assessed after silencing LINC01270 through Transwell assay. ***p < 0.001.
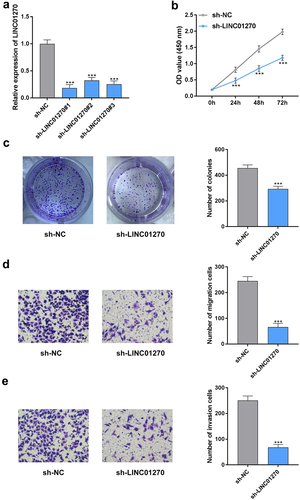
Figure 3. LINC01270 suppression reduced tumor growth in vivo.
(a–c) The tumor size, volume, and weight in nude mice were detected. (d) The Ki-67 expression was examined through IHC assay. ***p < 0.001.
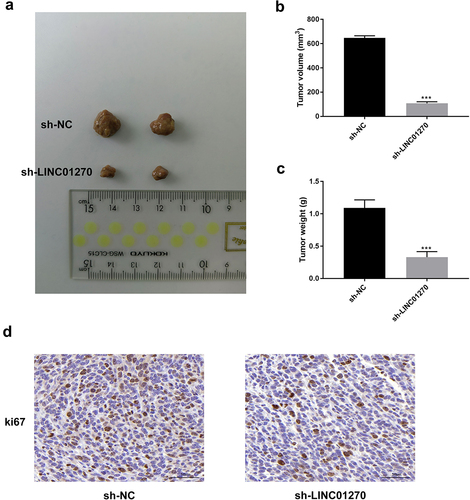
Figure 4. LINC01270 sponged miR-326.
(a) The binding sites between LINC01270 and miR-326. (b and c) The binding ability between LINC01270 and miR-326 was confirmed through luciferase reporter and RAN pull-down assays. (d) The expression of miR-326 was tested after silencing LINC01270 through RT-qPCR. (e) The expression of miR-326 was examined in GC tissues and normal adjacent tissues through RT-qPCR. (f) The correlation between LINC01270 and miR-326 was verified. ***p < 0.001.
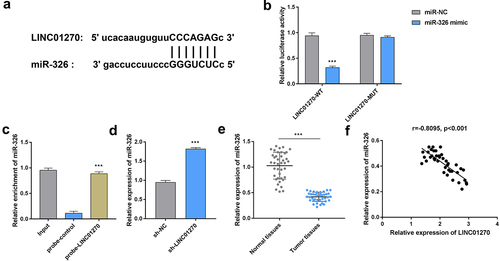
Figure 5. MiR-326 targeted and regulated EFNA3.
(a) The binding sites between miR-326 and EFNA3. (b and c) The binding ability between miR-326 and EFNA3 was confirmed through luciferase reporter and RAN pull-down assays. (d and e) The EFNA3 mRNA and protein expressions were detected after overexpressing miR-326 through RT-qPCR and western blot. (f) The expression of EFNA3 was evaluated in GC tissues and normal adjacent tissues through RT-qPCR. (g) The correlation between miR-326 and EFNA3 was confirmed. (h and i) The mRNA and protein expressions of EFNA3 were examined in the control, sh-LINC01270, sh-LINC01270+miR-inhibitor NC, and sh-LINC01270+miR-326 inhibitor through RT-qPCR and western blot. ***p < 0.001; ###p < 0.001 vs sh-LINC01270+miR-inhibitor NC.
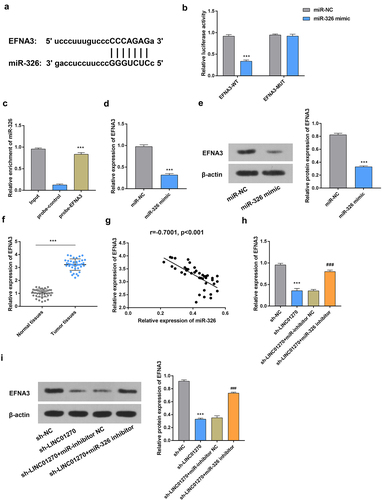
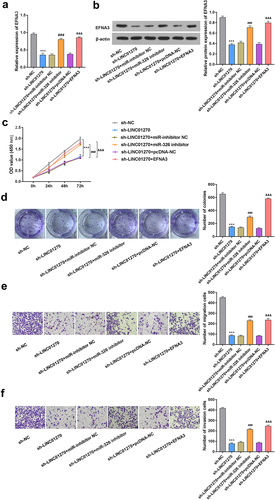
Figure 6. LINC01270 affected GC progression via miR-326/EFNA3 axis.
Groups were divided into the control, sh-LINC01270, sh-LINC01270+miR-inhibitor NC, sh-LINC01270+miR-326 inhibitor, sh-LINC01270+pcDNA-NC, and sh-LINC01270+EFNA3 groups. (a and b) The mRNA and protein expressions of EFNA3 were evaluated through RT-qPCR and western blot. (c and d) The cell proliferation was detected through CCK-8 and colony formation assays. (e and f) The cell migration and invasion abilities were examined through Transwell assay. ***p < 0.001 vs sh-NC.###p < 0.001 vs sh-LINC01270+miR-inhibitor NC; &&&p < 0.001 vs sh-LINC01270+pcDNA-NC.
Supplemental material
Supplemental Material
Download Zip (2.5 MB)Data availability statement
The authors confirm that the data supporting the findings of this study are available within the article.