Figures & data
Figure 7. Luciferase assays showed that miR-21 and miR-30e suppressed the expression of PTEN and miR-21 while inhibiting the expression of lncRNA-CASC7 (* P value < 0.05, vs. control group).
Figure 1. MEL treatment suppressed tumor cell growth in nude mice.
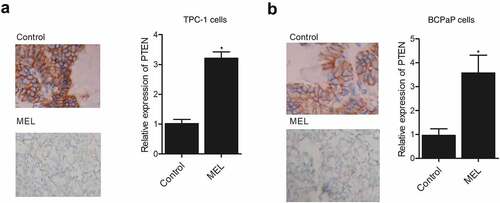
Figure 2. IHC analysis showed that the expression of PTEN protein in tumor tissues in nude mice was activated by MEL treatment (* P value < 0.05, vs. control group).
Figure 3. MEL treatment suppressed the expression of miR-30e and miR-21 while enhancing the lncRNA-CASC7 and PTEN mRNA expression as well as H2S production in the tumor tissues of nude mice (* P value < 0.05, vs. control group).
Figure 4. MEL inhibited the proliferation and activated the apoptosis of TPC-1 and BCPaP cells (* P value < 0.05, vs. untreated cells).
Figure 5. The expression of PTEN protein in TPC-1 and BCPaP cells was enhanced by MEL treatment (* P value < 0.05, vs. untreated cells).
Figure 6. MEL treatment suppressed the expression of miR-30e and miR-21 while enhancing the lncRNA-CASC7 and PTEN mRNA expression as well as H2S production in TPC-1 and BCPaP cells (* P value < 0.05, vs. untreated cells).