Figures & data
Figure 1. The chemical structure of HE.
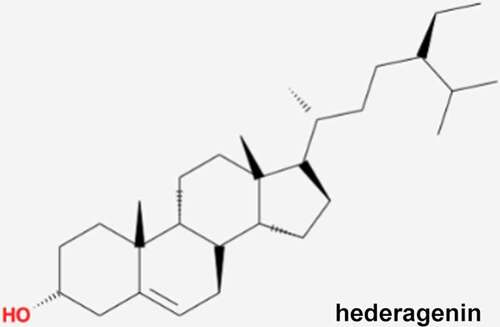
Figure 2. The effect of HE on the proliferation of TGF-β-induced NRK-49 F cells. The cell viability of TGF-β-induced NRK-49 F cells exposed to HE. ***P < 0.001 versus TGF-β. ##P < 0.01, ###P < 0.001 versus TGF-β + Hederagenin. Each experiment was repeated at least three times.
Figure 3. The effect of HE on the fibrosis of TGF-β-induced NRK-49 F cells. The expression of Col-I and Col-III (a) and (b) a-SMA in TGF-β-induced NRK-49 F cells exposed to HE. ***P < 0.001 versus TGF-β. ###P < 0.001 versus TGF-β + Hederagenin. Representative images were shown. Each experiment was repeated at least three times.
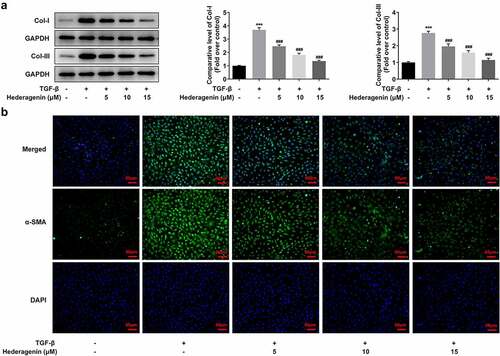
Figure 4. The effect of HE on the downstream proteins of TGF-β in TGF-β-induced NRK-49 F cells. ***P < 0.001 versus TGF-β. ###P < 0.001 versus TGF-β + Hederagenin. Representative images of western blot assay. Each experiment was repeated at least three times.
Figure 5. The expression of M1, M2 and M3 receptor in TGF-β-induced NRK-49 F cells. The expression of M1, M2 and M3 receptor in (a, b) NRK-49 F cells induced only by TGF-β, **P < 0.01, ***P < 0.001 versus Non-treated. and (c) in combination with HE, ***P < 0.001 versus TGF-β. ###P < 0.001 versus TGF-β + Hederagenin. Representative images of western blot assay. Each experiment was repeated at least three times.
Figure 6. The effect of M3 receptor interference on the proliferation of TGF-β-induced NRK-49 F cells. The transfection efficiency of M3 receptor was confirmed by WB and PCR (a-b). Representative images of western blot assay. ***P < 0.001 versus NS siRNA. The cell viability of TGF-β-induced NRK-49 F cells interfered by M3 receptor (c). **P < 0.01 versus Control. ###P < 0.001 versus TGF-β+ NS siRNA. NS siRNA is the control group of M3 receptor siRNA. Each experiment was repeated at least three times.
Figure 7. The effect of M3 receptor interference on the fibrosis of TGF-β-induced NRK-49 F cells. The expression of (a) Col-I and Col-III and (b) a-SMA in TGF-β-induced NRK-49 F cells interfered by M3 receptor. ***P < 0.001 versus Control. ###P < 0.001 versus TGF-β + NS siRNA. NS siRNA is the control group of M3 receptor siRNA. Representative images were shown. Each experiment was repeated at least three times.
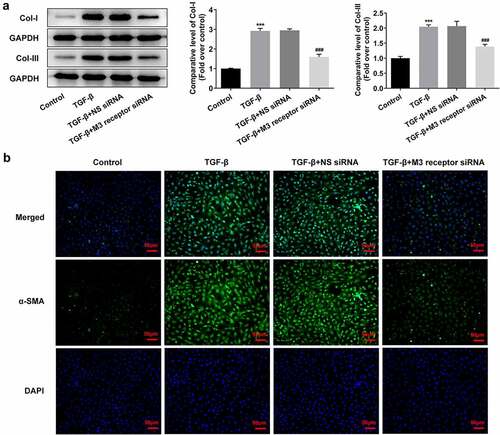
Figure 8. The role of M3 receptor on the downstream proteins of TGF-β in TGF-β-induced NRK-49 F cells. ***P < 0.001 versus Control. #P < 0.05, ###P < 0.001 versus TGF-β + NS siRNA. NS siRNA is the control group of M3 receptor siRNA. Representative images of western blot assay. The experiment was repeated at least three times.
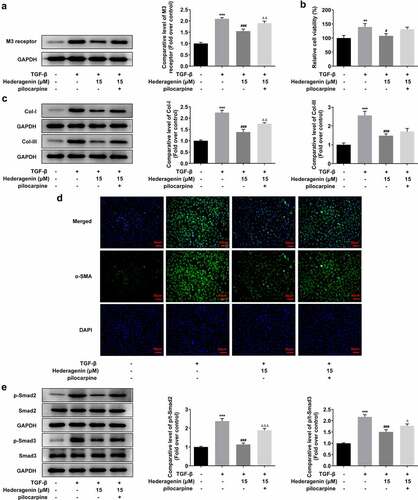
Figure 9. HE improves TGF-β-induced renal fibrosis via M3 receptor. (a) The expression of M3 receptor, (b) cell viability, (c) expression of Col-I and Col-III (d) a-SMA, and (e) downstream proteins of TGF-β in TGF-β-induced NRK-49 F cells exposed to HE and pilocarpine. **P < 0.01, ***P < 0.001 versus control, #P < 0.05, ### P < 0.001 versus TGF-β, ΔΔP<0.01 versus TGF-β + Hederagenin. Representative images were shown. Each experiment was repeated at least three times.