Figures & data
Figure 1. The biofunctions of LncRNA RPSAP52 in gastric cancer cells. The level of lncRNA RPSAP52 evaluated by RT-qPCR in varieties of gastric cancer cells (a). The level of lncRNA RPSAP52 evaluated by RT-qPCR following lncRNA RPSAP52 depletion (b). The cell viability at 24 and 48 h in MKN-28 (c) and SGC-7901 cells (d). The images of colony formation assay (e). The histogram for colony number (f). The cell cycle of MKN-28 and SGC-7901 cells detected by flow cytometry (g-i). The cell apoptosis assessed by flow cytometry (j). *, p < 0.05 and **, p < 0.01 vs. control group.
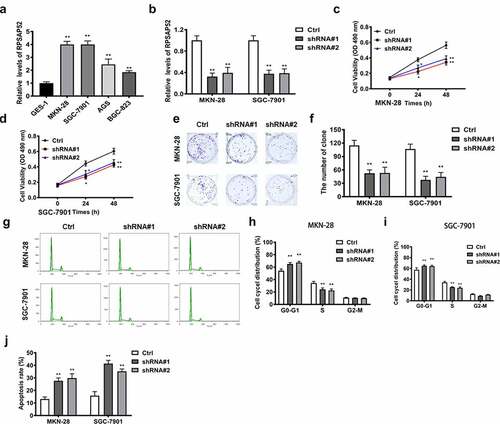
Figure 2. The biofunctions of lncRNA RPSAP52 in nude mice. The images of tumor-bearing mice (a); The tumor weight (b) and volume (c) in the study groups. The histopathologic changes assessed by HE staining (d); The expression level of ki-67 evaluated via immunohistochemical staining (e). **, p < 0.01 vs. control group.
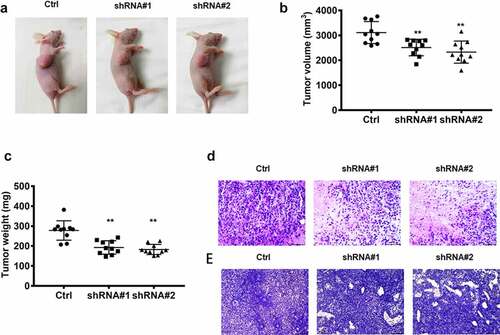
Figure 3. The relationship between lncRNA RPSAP52 and miR-665. The distribution percent of lncRNA RPSAP52 in cytoplasm and nucleus of MKN-28 (a) and SGC-7901 cells (b); Venn diagram of lncRNA RPSAP52 target gene in ENCORI and miRDB database (c); The binding sites between lncRNA RPSAP52 and miR-665 (d). The level of miR-665 detected by RT-qPCR (e); The luciferase report assay (f); The miRNA-665 level in complexes of RNA pull down assay was detected by RT-qPCR (g) and northern blot (h). **, p < 0.01 vs. control group.
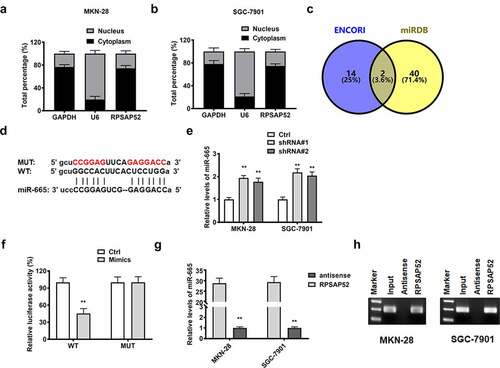
Figure 4. The biofunctions of miR-665 in gastric cancer cells. The level of miR-665 evaluated by RT-qPCR (a); The cell viability at 24 and 48 h in MKN-28 (b) and SGC-7901 cells (c); The images of colony formation assay (d); The histogram for colony number (e); The cell cycle of MKN-28 and SGC-7901 cells detected by flow cytometry (f-h); The cell apoptosis assessed by flow cytometry (i); **, p < 0.01 vs. control group.
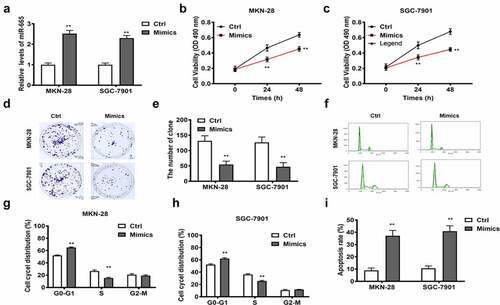
Figure 5. The relationship between miR-665 and STAT3.; Venn diagram of miR-665 target gene from TargetScan, miRDB and EVmiRNA database (a). The binding sites between miR-665 and STAT3 (b). The luciferase report assay in MKN-28 (c) and SGC-7901 cells (d). The miRNA-665 level in complexes of RNA pull down assay was detected by northern blot (e). The STAT3 detected by Western blot for exploring the regulatory relationship between miR-665 and STAT3 (f and g). The STAT3 detected by Western blot for exploring the regulatory relationship between lncRNA RPSAP52 and STAT3 (h and i) **, p < 0.01 vs. control group.
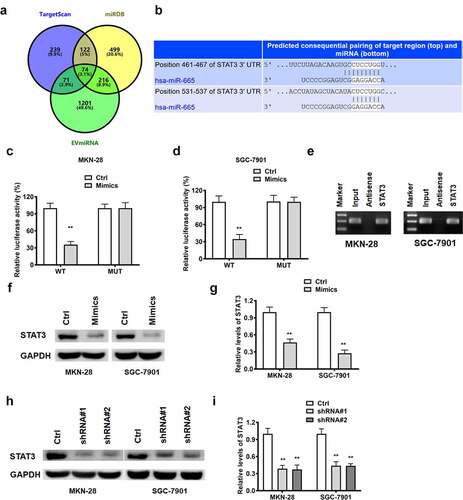
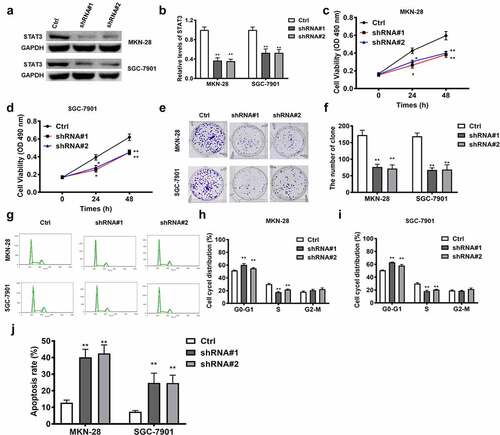
Figure 6. The biofunctions of STAT3 in gastric cancer cells. The level of STAT3 evaluated by Western blot (a and b). The cell viability at 24 and 48 h in MKN-28 (c) and SGC-7901 cells (d). The images of colony formation assay (e). The histogram for colony number (f). The cell cycle of MKN-28 and SGC-7901 cells detected by flow cytometry (g-i). The cell apoptosis assessed by flow cytometry (j). *, p < 0.05, **, p < 0.01 vs. control group.