Figures & data
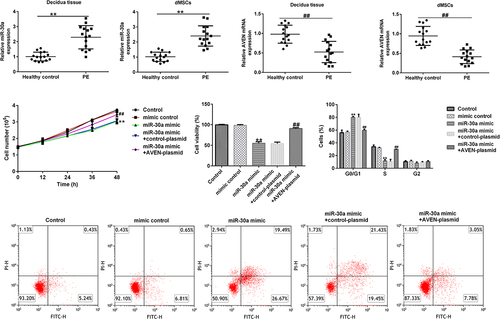
Figure 1. MiR-30a levels were increased in the decidua tissue and decidua MSCs (dMSCs) of patients with pre-eclampsia (PE) Quantitative reverse transcription-polymerase chain reaction (qRT-PCR) analysis of miR-30a levels in decidua tissue (a) and dMSCs (b) from healthy pregnancies and patients with PE. **P < 0.01.
Figure 2. AVEN directly targeted miR-30a (a). Binding site between miR-30a and AVEN was predicted using TargetScan. (b) Determination of miR-30a in 293 T cells after mimic control or miR-30a mimic transfection. (c). Dual-luciferase assay was performed to verify the relationship. Quantitative reverse transcription-polymerase chain reaction (qRT-PCR) analysis determined AVEN expression in the decidua tissue (d) and decidua MSCs (dMSCs) (e) of healthy pregnancies and patients with PE. **P < 0.01 vs. mimic control group; ##P < 0.01 vs. Healthy control.
Figure 3. MiR-30a negatively regulated AVEN expression(a). Quantitative reverse transcription-polymerase chain reaction (qRT-PCR) analysis of miR-30a levels in inhibitor control or miR-30a inhibitor transfected decidua MSCs (dMSCs). (b). Detection of AVEN expression in inhibitor control or miR-30a inhibitor transfected dMSCs using qRT-PCR. (c). qRT-PCR analysis of miR-30a levels in mimic control or miR-30a mimic transfected dMSCs. (d). Detection of AVEN expression in control-plasmid or AVEN-plasmid transfected dMSCs using qRT-PCR. Expression of AVEN in the mimic control, miR-30a mimic, control-plasmid, or AVEN-plasmid transfected dMSCs using qRT-PCR (e) and western blot assay (f). $$P < 0.01 vs. inhibitor control group; **P < 0.01 vs. mimic control group; ##P < 0.01 vs. control-plasmid group; &&P < 0.01 vs. miR-30a mimic+control-plasmid group.
Figure 4. MiR-30a suppressed decidua MSCs (dMSCs) proliferation, induced cell cycle arrest, and apoptosis by targeting AVEN (a) Cell proliferation was assessed using cell proliferation assay. (b). The growth of dMSCs was determined using the 3-(4,5-dimethylthiazol-2-yl)-2,5-diphenyl-2 H-tetrazolium bromide (MTT) assay. (c). Flow cytometry (FCM) was used to analyze cell numbers in different stages of cell division and the cell cycle data was shown using Graphpad 6.0. (d). FCM analysis of apoptotic cells. (e). Cell apoptosis rate was shown using Graphpad 6.0. **P < 0.01 vs. mimic control group; ##P < 0.01 vs. miR-30a mimic+control-plasmid group.
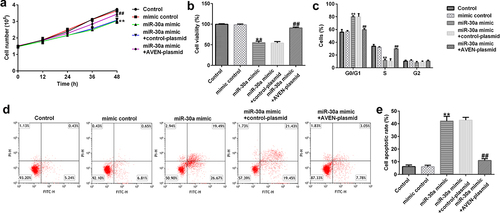
Figure 5. Decidua MSCs (dMSCs) overexpressed miR-30a suppressed HTR-8/SVneo migration. (a). HTR-8/SVneo cells migration was evaluated using transwell assay. (b). Number of migratory HTR-8/SVneo cells were presented. **P < 0.01 vs. mimic control group; ##P < 0.01 vs. miR-30a mimic+control-plasmid group.
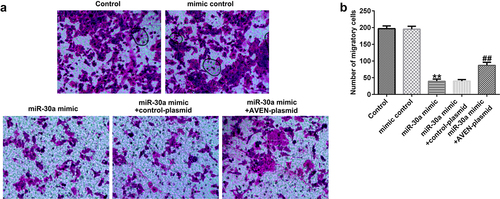
Figure 6. Decidua MSCs (dMSCs) overexpressed miR-30a suppressed human umbilical vein endothelial cell (HUVEC) tube formation.(a). Determination of HUVEC tube formation ability. (b). HUVEC tube formation was quantified. **P < 0.01 vs. mimic control group; ##P < 0.01 vs. miR-30a mimic+control-plasmid group.