Figures & data
Figure 1. The relative expression level of miR-200c in human OS. (a) The relative expression level of miR-200c in chondrocyte, U2-OS and Saos-2 cells by qRT-PCR. (b) The relative expression level of miR-200c in 6 normal bone tissues and 12 OS tissues. Data are expressed as the mean ± SD or median and 75% percentile of each group from three separate experiments. **P < 0.01, ***P < 0.001, ****P < 0.0001.
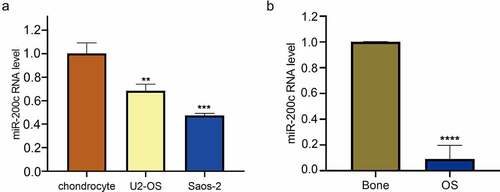
Figure 2. The effects of overexpression miR-200c on the proliferation, invasion, metastasis and apoptosis of Saos-2 cells in vitro. (a) Demonstration of the heterologous expression of miR-200c in Sao-2 cells by fluorescence microscope and qRT-PCR. (b) The proliferous results of control group and miR-200c overexpression group by RTCA xCELLigence system. (c) The invasive ability of control group and miR-200c overexpression group by Transwell assay. (d) The metastasizing ability of control group and miR-200c overexpression group by Migration assay. (e) Flow cytometry analysis of the percentage of apoptotic Saos-2 cells in control group and miR-200c overexpression group. Control group indicated that the Sao-2 cells without overexpression of miR-200c. Data are expressed as the mean ± SD or median and 75% percentile of each group from three separate experiments. *P < 0.05, ***P < 0.001, ****P < 0.0001.
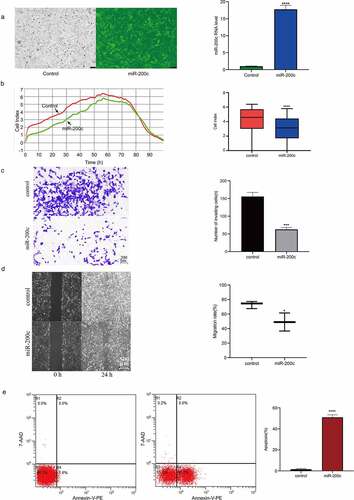
Figure 3. The effects of miR-200c on tumor growth in mice. (a) The dynamic growth (left) of the wildtype mice (control) and miR-200c overexpressed mice (miR-200c) and the volume (right) of the normal tumors (control) and the miR-200c implanted tumors (miR-200c) was monitored longitudinally. (b) At the end of the experiments, the weights of the formed tumor in wildtype mice (control) and miR-200c overexpressed mice (miR-200c) were measured. (c) qRT-PCR analysis of the relative RNA level of miR-200c in the normal tumors (control) and the miR-200c implanted tumors (miR-200c). Data are shown as the mean ± SEM of each group. ***P < 0.001, ****P < 0.0001.
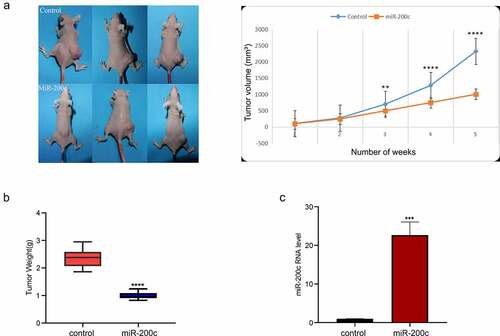
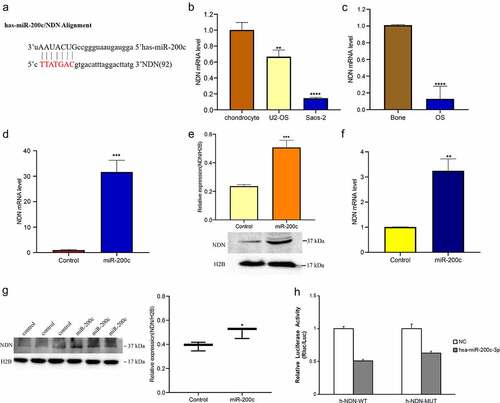
Figure 4. The expression of miR-200c on the expression of NDN in OS. (a) TargetScan and miRDB predicted that NDN is the potential target of miR-200c. (b) The expression level of NDN in chondrocyte, U2-OS and Saos-2 cells were determined by qRT-PCR. (c)The expression level of NDN in human OS (n = 12) and normal bone tissues (n = 6) were determined by qRT-PCR. (d) The relative transcription level of NDN in Sao-2 (control) and miR-200c overexpressed Saos-2 (miR-200c) cells were determined by qRT-PCR. (e) The relative expression of NDN in miR-200c overexpressed Saos-2 cells were detected by western blot. (g) The relative expression of NDN in miR-200c overexpressed mice (miR-200c) and the wild type mice (control) were determined by western blot. H2B is a reference gene. (h) The results of the dual-luciferase reporter gene experiment. Data are representative images or expressed as the mean ± SEM of each group from three separate experiments. *P < 0.05, **P < 0.01, ***P < 0.001, ****P < 0.0001.