
Figures & data
Figure 1. Bioinformatics analysis predicts GC-related differentially expressed miRNAs and their potential downstream mRNAs. A: A heat map of differential expression of miRNAs in GC samples based on GC-related miRNA expression dataset GSE93415. B: The intersection of predicted target genes of miR-642b-3p by the TargetScan and miRDB databases and down-regulated genes in GC samples in the GC-related gene expression datasets GSE19826 and GSE79973. C, The expression of CSMD1 in GC samples in the GSE19826 dataset. D: The expression of CSMD1 in GC samples in the GSE79973 dataset.
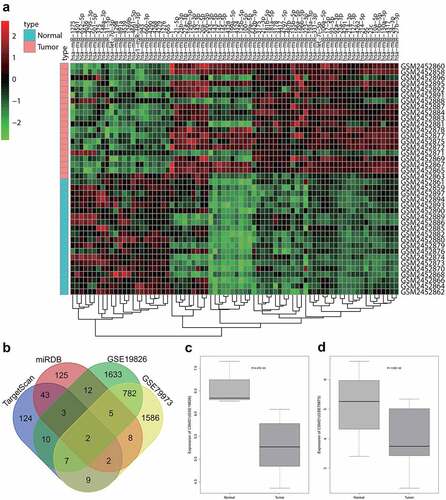
Figure 2. miR-642b-3p is highly expressed in GC tissues and cells. A: miR-642b-3p expression in GC tissues (n = 30) and adjacent normal tissues (n = 30) determined by qRT-PCR; * p < 0.05 versus the adjacent normal tissues; B: miR-642b-3p expression in normal gastric mucosal epithelial cell line GES-1 and GC cell lines SNU-5, AGS, MKN-74, HGC-27 and KATO III determined by qRT-PCR; * p < 0.05 versus the GES-1 cell line, # p < 0.05 versus the SNU-5 cell line. Measurement data were presented as mean ± standard deviation. Data between two groups were performed by independent sample t-test. Data among multiple groups were compared by one-way ANOVA with Tukey’s post hoc test. The cell experiment was repeated three times independently.
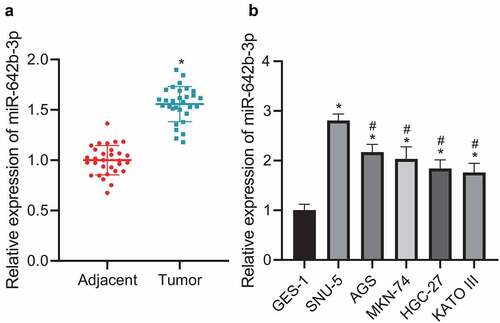
Figure 3. miR-642b-3p down-regulates the expression of CSMD1 and suppresses the EMT of GC cells. A: The predicted binding sites between miR-642b-3p and CSMD1; B: The binding between miR-642b-3p and CSMD1 verified by dual luciferase reporter assay. C: miR-642b-3p and CSMD1 expression in SNU-5 cells transfected with miR-642b-3p mimic or miR-642b-3p inhibitor determined by qRT-PCR; D: Immunofluorescence staining images of N-cadherin protein in SNU-5 cells treated with miR-642b-3p mimic, CSMD1 or both; E: Immunofluorescence staining images of E-cadherin in SNU-5 cells treated with miR-642b-3p mimic, CSMD1 or both; F: Quantitative analysis of the positive rate of N-cadherin and E-cadherin proteins in SNU-5 cells treated with miR-642b-3p mimic, CSMD1 or both; G: α-SMA, FN, N-cadherin and E-cadherin protein expression in SNU-5 cells treated with miR-642b-3p mimic, CSMD1 or both determined by western blot normalized to GAPDH. * p < 0.05 versus the miR-642b-3p mimic NC group, # p < 0.05 versus the CSMD1 NC group, & p < 0.05 versus the CSMD1 group. Measurement data were presented as mean ± standard deviation. Data among multiple groups were compared by one-way ANOVA with Tukey’s post hoc test. The cell experiment was repeated three times independently.
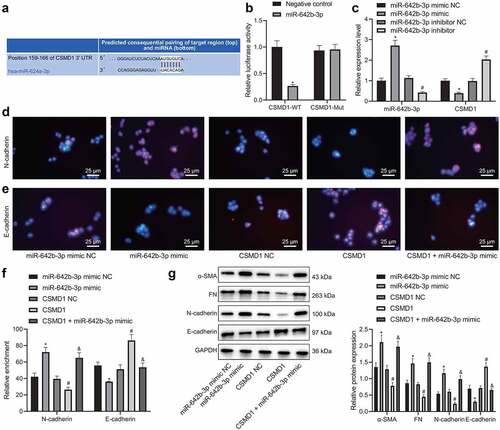
Figure 4. miR-642b-3p down-regulates the expression of CSMD1 and impedes the migration and invasion of GC cells. A: Representative images of migration of SNU-5 cells treated with miR-642b-3p mimic, CSMD1 or both measured by wound healing assay; B: Quantitative analysis of panel A; C: Representative images of invasion of SNU-5 cells treated with miR-642b-3p mimic, CSMD1 or both measured by Transwell assay; D: Quantitative analysis of panel C; E: qRT-PCR detection of relative mRNA expression of metastasis-related genes MMP-2 and MMP-9 in SNU-5 cells treated with miR-642b-3p mimic, CSMD1 or both; F: Protein expression of metastasis-related genes MMP-2 and MMP-9 in SNU-5 cells treated with miR-642b-3p mimic, CSMD1 or both as determined by western blot normalized to GAPDH. Measurement data were presented as mean ± standard deviation. Data among multiple groups were compared by one-way ANOVA with Tukey’s post hoc test. * p < 0.05 versus the miR-642b-3p mimic NC group, # p < 0.05 versus the CSMD1 NC group, & p < 0.05 versus the CSMD1 group. The cell experiment was repeated three times independently.
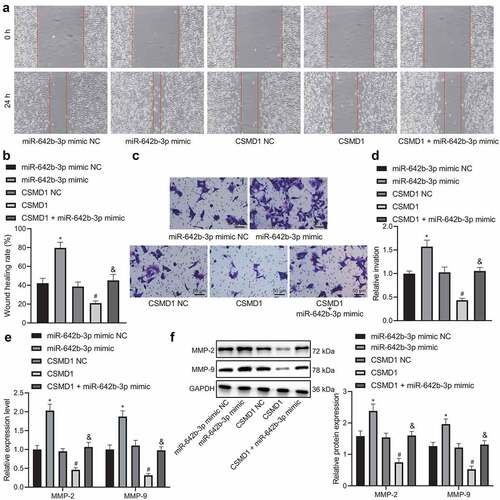
Figure 5. Overexpression of CSMD1 promotes activation of Smad signaling pathway, thus suppressing the EMT, migration and invasion of GC cells. A: qRT-PCR detection of Smad7 and Smad4 mRNA expression in SNU-5 cells treated with CSMD1 or combined with SB431542; B: Representative western blots of Smad7 and Smad4 proteins in SNU-5 cells treated with CSMD1 or combined with SB431542; C: Quantification of Smad7 and Smad4 protein expression in SNU-5 cells treated with CSMD1 or combined with SB431542; In panel A-C, * p < 0.05 versus the CSMD1 group, # p < 0.05 versus the CSMD1 group. D: Immunofluorescence staining images of N-cadherin and E-cadherin proteins in SNU-5 cells treated with CSMD1 or combined with SB431542; E: α-SMA, FN, N-cadherin and E-cadherin protein expression in SNU-5 cells treated with CSMD1 or combined with SB431542 determined by western blot; F: Migration of SNU-5 cells treated with CSMD1 or combined with SB431542 measured by wound healing assay; G: Invasion of SNU-5 cells treated with CSMD1 or combined with SB431542 measured by Transwell assay; H: qRT-PCR detection of relative mRNA expression of metastasis-related genes MMP-2 and MMP-9 in SNU-5 cells treated with CSMD1 or combined with SB431542; I: Protein expression of metastasis-related genes MMP-2 and MMP-9 in SNU-5 cells treated with CSMD1 or combined with SB431542 as determined by western blot. * p < 0.05 versus the CSMD1 NC group. Measurement data were presented as mean ± standard deviation. Data among multiple groups were compared by one-way ANOVA with Tukey’s post hoc test. The cell experiment was repeated three times independently.
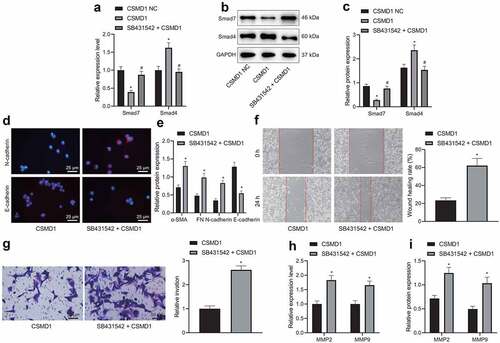
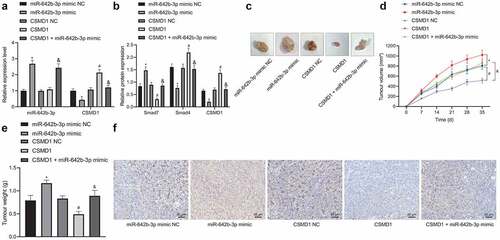
Figure 6. miR-642b-3p downregulates CSMD1 to inactivate the Smad signaling pathway, thereby enhancing the tumor growth of GC cells in nude mice. A: qRT-PCR detection of miR-642b-3p and CSMD1 expression in the tumor tissues of mice treated with miR-642b-3p mimic, CSMD1 or both; B: CSMD1, Smad4 and Smad7 protein expression in the tumor tissues of mice treated with miR-642b-3p mimic, CSMD1 or both; C: Representative photographs of the xenograft tumors in the nude mice treated with miR-642b-3p mimic, CSMD1 or both; D: Quantitative analysis of volume of the xenograft tumor in the nude mice treated with miR-642b-3p mimic, CSMD1 or both; E: Quantitative analysis of weight of the xenograft tumor in the nude mice treated with miR-642b-3p mimic, CSMD1 or both; F: Microvessel density of tumors in nude mice treated with miR-642b-3p mimic, CSMD1 or both as detected by immunohistochemical assay. n = 6. * p < 0.05 versus the miR-642b-3p mimic NC group, # p < 0.05 versus the CSMD1 NC group, & p < 0.05 versus the CSMD1 group. Measurement data were presented as mean ± standard deviation. Data among multiple groups were compared by one-way ANOVA with Tukey’s post hoc test. Data at various time points were compared by repeated measures ANOVA with Tukey’s post hoc test.
Supplemental Material
Download Zip (157.1 KB)Data availability statement
The data that supports the findings of this study are available in the manuscript and supplementary materials.