Figures & data
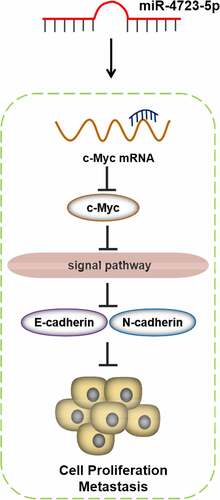
Figure 1. The level of c-myc mRNA detected with real-time PCR after transfection of shRNA in MDA-MB-231 cells. **P < 0.01.
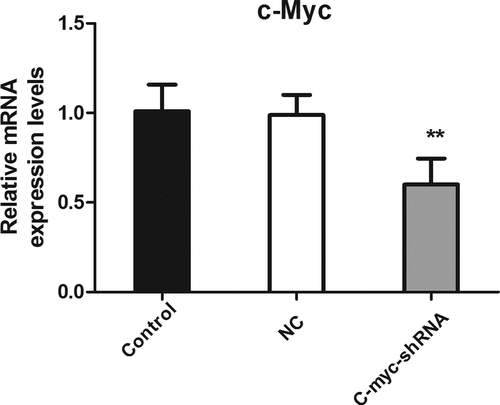
Table 1. The top 10 differentially up-regulated and down-regulated miRNAs
Figure 2. Heat map of upregulated and downregulated differentially expressed miRNAs after knocking down c-myc. Each column represents a sample, and each row represents a differential miRNA. Red indicates high expression, and green indicates low expression.
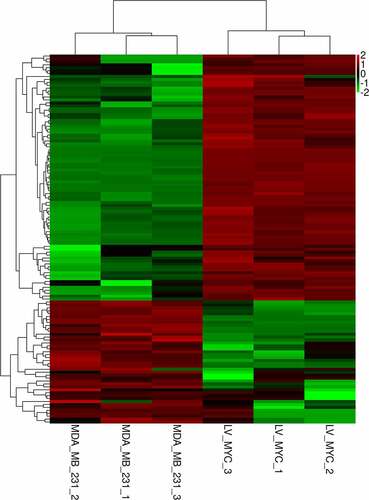
Figure 3. The top-10 enriched GO terms of target genes of differentially expressed miRNAs. The ordinate is the number of genes enriched by GO, and the abscissa is the name of the GO term.
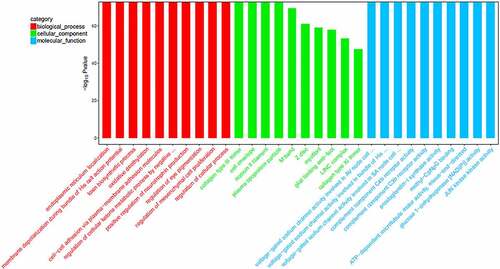
Figure 4. KEGG pathway enrichment bubble chart of top-20 enriched pathways of target genes of differentially expressed miRNAs. Each dot corresponds to a pathway. The color gradient, from red to purple, corresponds to the P value. The lower the P value, the more the color tends toward red. The larger the dot, the more genes in the pathway.
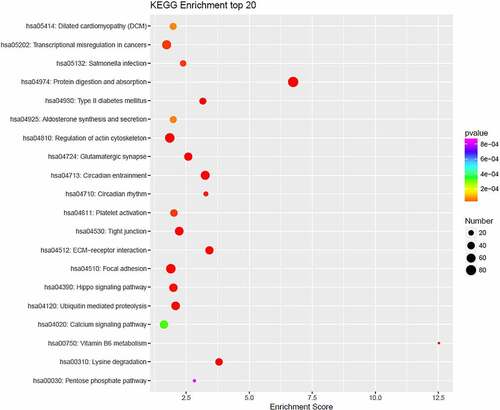
Table 2. Some representative target genes of hsa-miR-4723-5p
Table 3. The top 8 enriched GO terms and KEGG pathways of target genes of hsa-miR-4723-5p
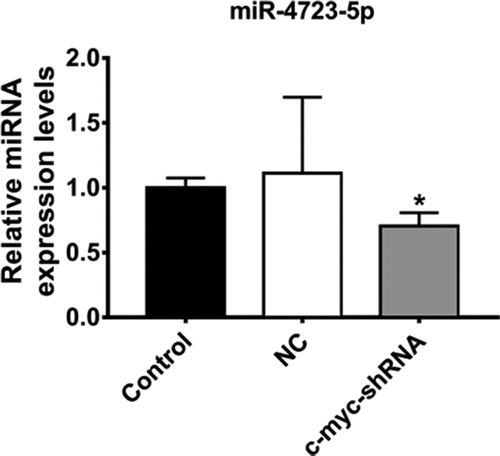
Figure 5. The expression levels of miR-4723-5p verified by real-time PCR. The expression level of miR-4723-5p. *P < 0.05, **P < 0.01.