Figures & data
Figure 1. CAR plasmid construction and validation. (a) c-Met CAR structure diagram; (b) Agarose gel electrophoresis of plasmid digestion; (c) Schematic diagram of lentiviral vector plasmid structure.
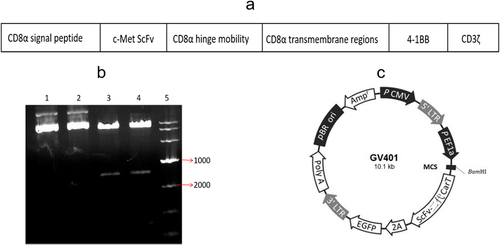
Figure 2. Validation of gene and protein levels of second-generation CAR molecules, (a) PCR detection for the presence of second-generation CAR sequences in c-Met CAR-T cells (p ≤ 0.01 vs Untransduced T cells) Note: Lane 1 is genomic DNA of c-Met CAR T cells, lane 2 is genomic DNA of activated T cells, and lane 3 is reference TAKara DNA marker. (b) Western blot to detect CD3ζ expression in c-Met CAR-T cells. Exogenous CD3ζ shows the molecular weight of the fusion protein, and the molecular weights of CD19 CARs and c-Met CARs are both around 55KD. (c) Infection efficiency of c-Met CAR-T lentivirus, expressed EGFP. Gating strategy used to determine EGFP surface expression on c-Met CAR-T was established based on blank control (Untransduced T cells), FITC mode with the same wavelength as EGFP was used for detection .Numbers represent the percentage of gated cells. (d)Infection efficiency of CD19 CAR-T lentivirus, expressed EGFP. Gating strategy used to determine EGFP surface expression on CD19 CAR-T was established based on blank control (Untransduced T cells), FITC mode with the same wavelength as EGFP was used for detection. Numbers represent the percentage of gated cells. (e)The statistical analysis of lentivirus infection efficiency.
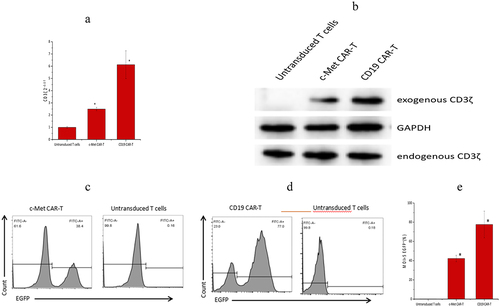
Figure 3. Proportion of T cell subtypes before and after lentivirus infection. (a) Flow cytometric analysis of c-Met CAR, CD19 CAR and CD4, CD8 subtypes of activated T cells; CD4+ and CD8+ proportion in c-Met CAR-T, CD19 CAR-T and Untransduced T cells are shown. From day 7 to day 12. The cells were stained with PE conjugated anti-CD4 mAb and PC-5.5 conjugated anti-CD8 mAb, followed by fixed with paraformaldehyde, and analyzed flow cytometry.The numbers indicated in each panel indicate the proportion of cells in the designated area. (b) Statistical analysis of c-Met CAR-T, CD19 CAR-T and CD4+, CD8+ subtypes of c-Met CAR-T, CD19 CAR-T and activated T cells. Summary of the results from the 3 individual experiments described the mean ± SEM, Two sample paired Student’s t-tests were used to determine statistical significance.(*p < 0.01 vs Untransduced T cells).
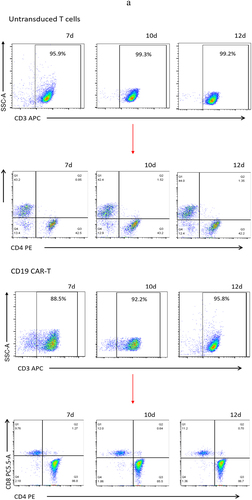
Figure 3. Continued.
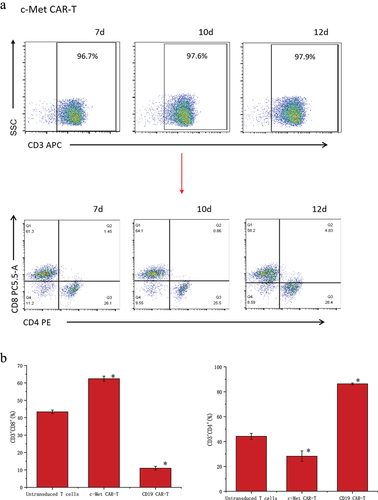
Figure 4. Expression levels of c-Met on the surface of cancer cell lines detected by flow cytometry. A549 cells and A2780 cells were stained with FITC conjugated anti c-Met mAb(red),Unstained cells were used as blank control(blue).The results represent the mean of 3 independent experiments. Histogram data are represented as mean ± standard deviation (N = 3) of relative FITC expression levels as compared to blank control.Two sample paired Student’s t-tests were used to determine statistical significance. (*p < 0.01 vs the c-Met expression of A2780).
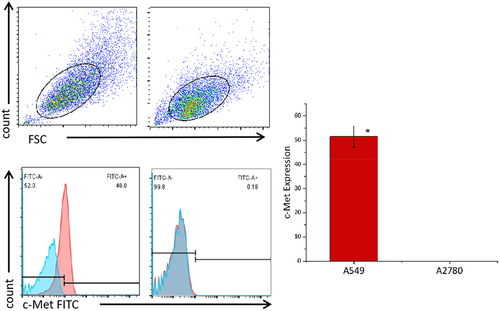
Figure 5. Proliferation activity of CAR-T cells stimulated by target antigen,CCK8 assay for enumeration of c-Met CAR-T which were stimulated by A549 cells.4 × 104 of c- Met CAR-T, D19 CAR-T or untransduced T cells were incubated with 8 × 10³ A549 cells in 24 h, 48 h, 72 h. Add ccK-8 reagent and reaction at 37°C for 2 h before assay was developed,The number of cells was calculated according to the OD value.The results represent the mean of 3 independent experiments Line chart showing the represented as mean ± standard deviation of overall number of c-Met CAR-T,CD19 CAR-T or untransduced T cells.The data display the cells number change with time. Data of experiments conducted in triplicate are analyzed by two sample paired Student’s t-test comparing A549 cells stimulated c-Met CAR-T with A2780 stimulated c-Met CAR-T and comparing A549 cells stimulated c-Met CAR-T with A549 stimulated CD19 CAR-T or untransduced T cells(set to 1).p < 0.05 are considered significant (*p < 0.05 vs CD19 CAR-T+ A549;#p < 0.05 vs T+ A549;&p < 0.05 vs c-Met CAR-T+ A2780).
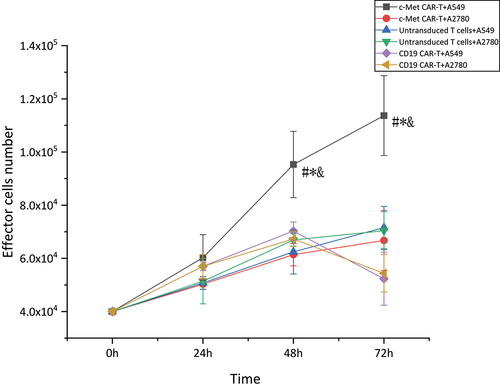
Table 1. Expression of c-Met in NSCLC and para-carcinoma tissue
Figure 6. Immunohistochemical detection of c-Met expression in NSCLC and its adjacent adjacent tissues. (a) NSCLC clinical specimens IHC with moderate (IHC++), (b and c) NSCLC clinical specimens IHC with strong (IHC+++) staining, respectively. (D ~ F) The paracancerous tissue specimen was negative for c-Met based on IHC analysis(×400).
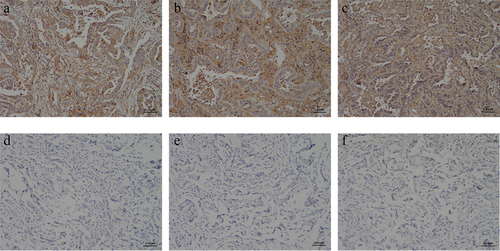
Figure 7. Targeted killing of c-Met CAR T cell.c-Met CAR-T or CD19 CAR-T or untransduced T cells cocultured with A549 cells at E:T = 1:1, 5:1, 10:1 or 20:1 for 6 hours. (a) Cytotoxicity of c-Met CAR-T cells against A549 or A2780 cells was determined by LDH assay. The results represent the mean of six independent experiments. Line graph data reflect the mean ± SEM of experiments conducted in triplicate are anlysis by two sample paired Student’s t-test comparing cytotoxicity of c-Met CAR-T to A549 cells with cytotoxicity of CAR-T to A2780 cells and comparing cytotoxicity of c-Met CAR-T to A549 cells, with cytotoxicity of CD19 CAR-T or untransduced T to A549 cells cells.p < 0.05 are considered significant. (b)Cytokine release was determined by ELISA assay.Bar graph data reflect the mean ± SEM of experiments conducted in triplicate are anlysis by two sample paired Student’s t test comparing cytokine release of A549 cells stimulated c-Met CAR-T with A2780 stimulated c-Met CAR-T and comparing cytokine release of A549 cells stimulated c-Met CAR-T with A549 stimulated CD19 CAR-T or untransduced T cells(set to 1).p < 0.05 are considered significant (*P < 0.05 vs CD19 CAR-T+ A549;#P < 0.05 vs T+ A549;&P < 0.05 vs c-Met CAR-T+ A2780).
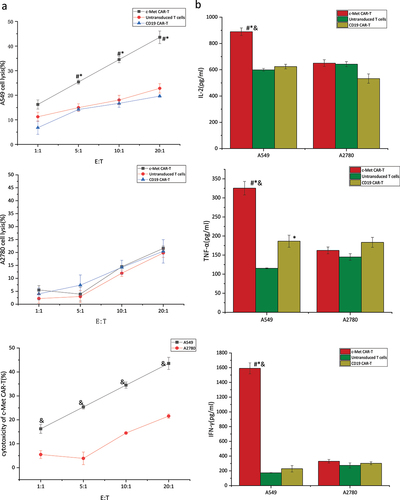
Figure 8. Anti-tumor effects of the anti c-Met CAR-T cells in subcutaneously implanted tumor model in nude model of human NSCLC. (a)A549-Luc (3 × 10⁶ cells) with Matrigel were injected Subcutaneous tissue below right foreleg into the space of nude mice on day 0, followed by iv injection of 1 × 10⁷ CAR-T or Untransduced T cells or same volume of PBS on day 14 and 17,. Tumor growth was assessed using vernier caliper; (b) Representative bioluminescence images of the mice are shown.; (c): line graph displays Size of tumor increased with time is shown as mean ± SEM. Data from 5 independent experiments are combined (N = 5*P < 0.05 vs CAR-T group); (d)Bar graph displays Tumor quality of nude mice in each group after treatment is shown as mean ± SEM. Data from 5 independent experiments are combined (N = 5,*p < 0.05 vs Untransduced T cells group, p < 0.05 vs Blank group).;(e)Line graph displays body weight fluctuation curve of nude mice in each group during treatment is shown as mean ± SEM. Data from 5 independent experiments are combined (N = 5).
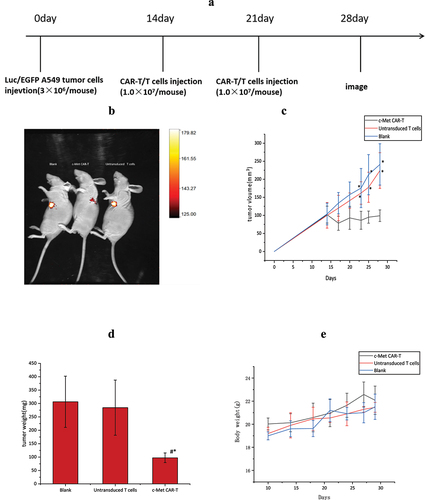
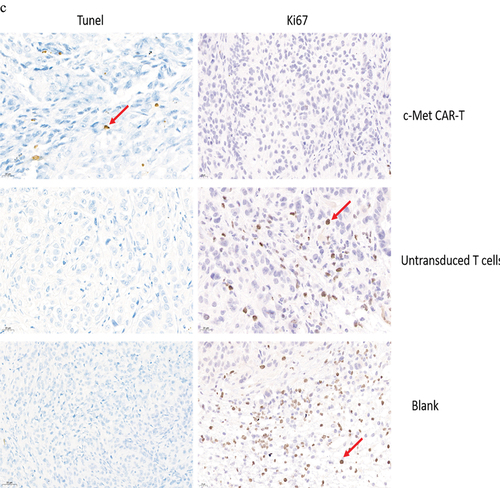
Figure 9. HE and immunohistochemical staining of internal organ and subcutaneous transplanted tumors was performed in 3 groups. Internal organ and Tumor specimens were collected on day 30; (a) HE staining was performed to evaluate the pathological changes of lung, liver, kidney and spleen tissue from the 3 group (×400); (b)c-Met was mainly located in the cytoplasm and on the surface of A549 cells. Strong and diffuse expression of c-Met in Blank group and untransduced T cells group (Cells membrane and cytoplasm stained in yellow brown were the positive pattern, red arrow). c-Met CAR-T group with poor expression of c-Met(× 400); (c) IHC staining of Ki-67 in 3 groups of A549 cell xenograft tumors; The morphological change of apoptosis was observed by TUNEL method(Cells nucleus stained in yellow brown were the positive pattern, red arrow). (×400).
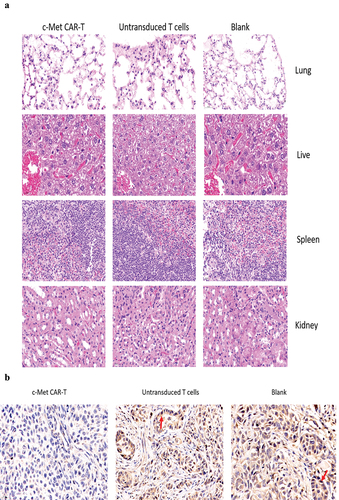
Figure 9. Continued.