Figures & data
Table 1. The sequences of the primers in this study
Figure 1. LAMC2 was selected to be potentially modulated by BBOX1-AS1/miR-3940-3p thus affecting oral cancer progression. (a) The expression of miR-3940-3p and miR-361-3p in our collected tissue samples. (b) The intersection between the predicted mRNA list of miR-3940-3p and the differentially expressed mRNAs in oral cancer (data obtained from GSE19089 data analysis with adjusted P < 0.05 and logFC≥1.5). (c) LAMC2 expression in head and neck squamous cell carcinoma (HNSCC) of GEPIA database. (d) Overall survival outcome of distinct LAMC2 expression levels in head and neck squamous cell carcinoma. *p < 0.05 and **p < 0.01.
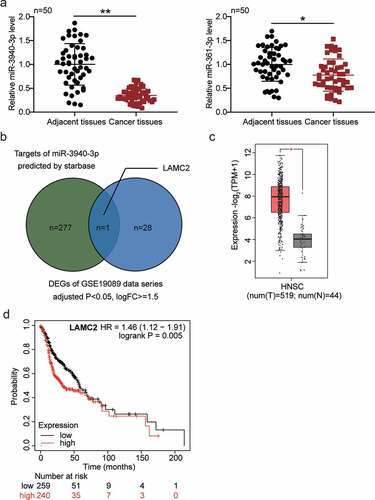
Figure 2. BBOX1-AS1 was upregulated in OSCC and downregulation of BBOX1-AS1 exerted its oncosuppressive functions in OSCC cells. (a) BBOX1-AS1 mRNA expression in OSCC and adjacent normal tissues. **p < 0.01. (b) Expression of BBOX1-AS1 in normal human oral keratinocytes (NHOK) and four OSCC cells (SAS, OECM1, OC3 and HSC3) were analyzed using RT-qPCR. **p < 0.01 vs. NHOK. (c) RT-qPCR was employed to confirm the shRNA-mediated BBOX1-AS1 knockdown efficiency. **p < 0.01 vs. sh-NC. (d) Effect of shRNA for BBOX1-AS1 on the activity of SAS and OC3 cells was detected by CCK-8 assay. **p < 0.01 vs. sh-NC. (e) Effect of shRNA for BBOX1-AS1 on the proliferation of SAS and OC3 cells was detected by BrdU proliferation assay. **p < 0.01 vs. sh-NC. (f) Effect of shRNA for BBOX1-AS1 on the migration of SAS and OC3 cells was detected by Transwell assay. **p < 0.01 vs. sh-NC. (g) Effect of shRNA for BBOX1-AS1 on the expression of Bcl-2 and Bax in SAS and OC3 cells was tested by western blotting. **p < 0.01 vs. sh-NC.
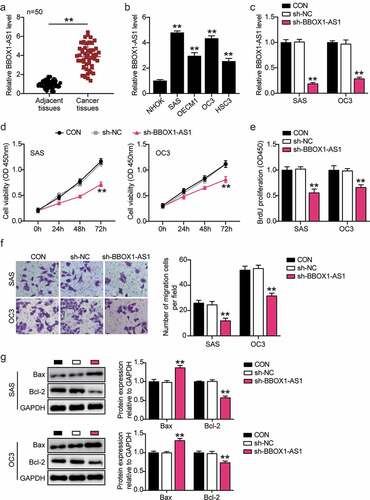
Figure 3. MiR-3940-3p was a direct downstream target of BBOX1-AS1. (a) FISH assay was performed to detect the subcellular location of BBOX1-AS1. (b) The binding sites between BBOX1-AS1 and miR-3940-3p. (c) The interaction between BBOX1-AS1 and miR-3940-3p was determined by a luciferase reporter assay. **p < 0.01 vs. mimic NC. (d) The targeting relationship between BBOX1-AS1 and miR-3940-3p was determined by the RIP assay. **p < 0.01 vs. Anti-IgG. (e) Correlation between BBOX1-AS1 expression and miR-3940-3p was analyzed by Spearman’s analysis. (f) Expression of miR-3940-3p in normal NHOK cells and four OSCC cells (SAS, OECM1, OC3 and HSC3) were analyzed by RT-qPCR. **p < 0.01 vs. NHOK. (g) Effect of shRNA for BBOX1-AS1 on the expression of miR-3940-3p was analyzed using RT-qPCR. **p < 0.01 vs. sh-NC.
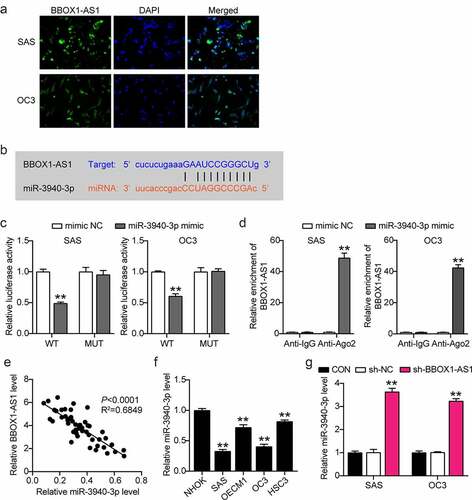
Figure 4. BBOX1-AS1 exerted its oncogenic roles in OSCC cells by interacting with miR-3940-3p. (a) MiR-3940-3p inhibitor transfection efficiency of SAS and OC3 cells was determined using RT-qPCR. (b) BBOX1-AS1 silencing results in the SAS and OC3 cell viability via CCK-8 assay. (c) Cell proliferation in SAS and OC3 cells after transfection with shRNA-BBOX1-AS1 miR-3940-3p inhibitor via BrdU proliferation assay. (d) Cell migration in SAS and OC3 cells co-transfected with shRNA-BBOX1-AS1 miR-3940-3p inhibitor was detected by Transwell assay. (e) Expression of Bcl-2 and Bax in SAS and OC3 cells co-transfected with shRNA-BBOX1-AS1 miR-3940-3p inhibitor was detected by western blotting. **p < 0.01 vs. inhibitor NC; ##p < 0.01 vs. inhibitor.
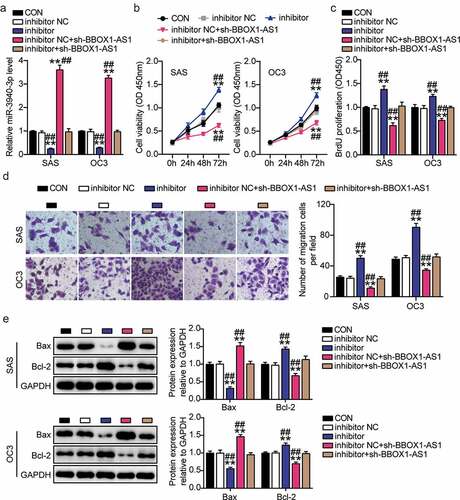
Figure 5. MiR-3940-3p was a negative upstream regulator of LAMC2. (a) The binding sites between miR-3940-3p and LAMC2. (b) The interaction of miR-3940-3p and LAMC2 was validated using a luciferase reporter assay. **p < 0.01 vs. mimic NC. (c) The targeting relationship between BBOX1-AS1 and miR-3940-3p was determined by a pull-down assay. **p < 0.01 vs. Bio-miR-3940-3p. (d) Expression of LAMC2 in OSCC tissues and normal tissues was detected by RT-qPCR. **p < 0.01. (e) Correlation between expression levels of miR-3940-3p and LAMC2 was analyzed by Spearman’s analysis. (f) Expression of LAMC2 in normal NHOK cells and four OSCC cells (SAS, OECM1, OC3 and HSC3) were analyzed using RT-qPCR. **p < 0.01 vs. NHOK.
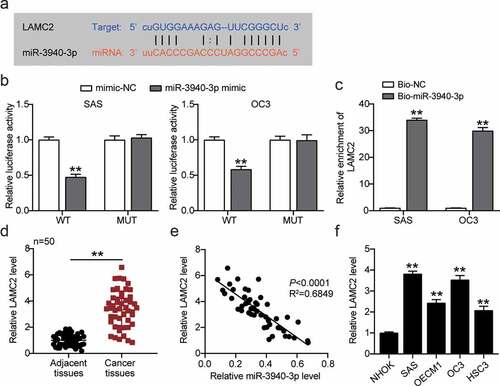
Figure 6. Downregulation of LAMC2 counteracted the effect of miR-3940-3p knockdown on OSCC cells(a) LAMC2 shRNA knockdown efficiency was detected by RT-qPCR. (b) LAMC2 shRNA knockdown efficiency was validated using a western blot assay. (c) MiR-3940-3p inhibitor and LAMC2 silencing results in the SAS and OC3 cell viability via CCK-8 assay. (d) Cell proliferation in SAS and OC3 cells after transfection with miR-3940-3p inhibitor and shRNA-LAMC2 via BrdU proliferation assay. (e) Cell migration in SAS and OC3 cells co-transfected with miR-3940-3p inhibitor and shRNA-LAMC2 was detected by Transwell assay. (f) Bcl-2 and Bax protein expressions in transfected SAS and OC3 cells were assessed using western blotting. **p < 0.01 vs. inhibitor NC; ##p < 0.01 vs. sh-NC.
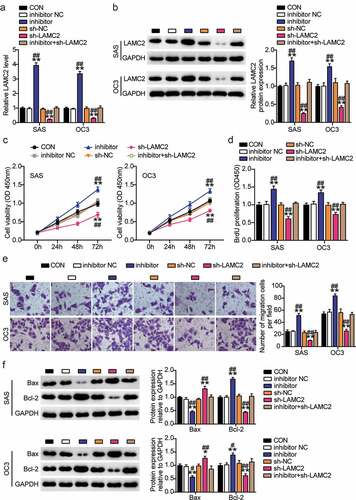
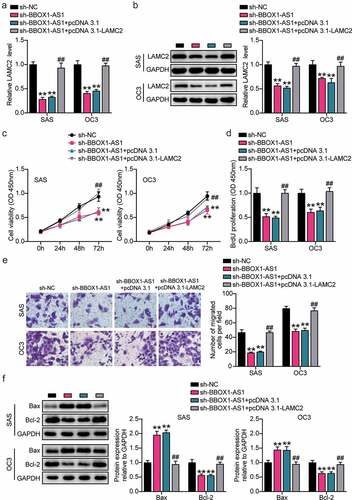
Figure 7. BBOX1-AS1 facilitated the proliferation, migration and suppressed apoptosis of OSCC cells through regulating LAMC2. (a) RT-qPCR was used to detect the LAMC2 level in SAS and OC3 cells after transfecting sh-BBOX1-AS1 and pcDNA3.1- LAMC2. (b) Western blot assay was used to detect the LAMC2 level in SAS and OC3 cells after transfecting sh-BBOX1-AS1 and pcDNA3.1- LAMC2. (c) Cell viability was detected by CCK-8 assay after after transfecting sh-BBOX1-AS1 and pcDNA3.1- LAMC2. (d) Cell proliferation was detected in SAS and OC3 cells after transfecting sh-BBOX1-AS1 and pcDNA3.1- LAMC2 via BrdU proliferation assay. (e) Cell migration was detected by Transwell assay after transfecting sh-BBOX1-AS1 and pcDNA3.1- LAMC2. (f) Bcl-2 and Bax protein expressions in transfected SAS and OC3 cells was were assessed using western blotting. **p < 0.01 vs. sh-NC; ##p < 0.01 vs. sh- BBOX1-AS1.