Figures & data
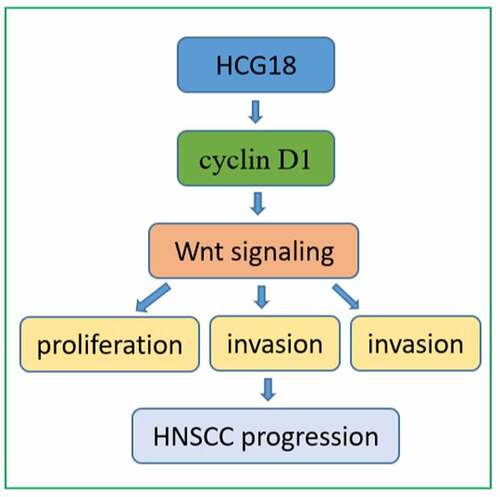
Table 1. Relationship between Expression of HCG18 and clinicopathologic parameters in HNSCC patients
Figure 1. Expression of HCG18 and its clinical significance in HNSCC. (a) Expression of HCG18 in HNSCC tissues and adjacent normal tissues (n = 50); (b) OS of HNSCC patients; (c) Expression of HCG18 in HNSCC cell lines (SCC4, SCC25, HN6, HN30, CAL27 and CAL33) and HOK cells; Error bars represent the mean ± SD of triplicate experiments. *P < 0.05; **P < 0.01; ***P < 0.001.
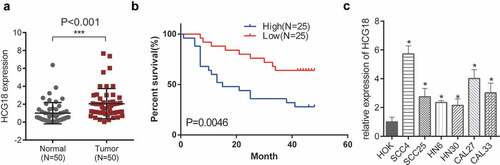
Figure 2. HCG18 promoted cell proliferation of HNSCC in vitro. SCC4 and HN30 cells were transfected with silencing HCG18 siRNA (si-HCG18), scrambled siRNA, overexpressed plasmid (ov-HCG18) or vector plasmid for 48 h, respectively; (a) colony formation assays were performed and representative image was shown; (b) colony number was counted; viability of transfected SCC4 (c) and HN30 (d) cells was accessed by CCK8 assay. Significant differences between groups were analyzed by independent samples t-test. Error bars represent the mean ± SD of triplicate experiments. *P < 0.05; **P < 0.01; ***P < 0.001.
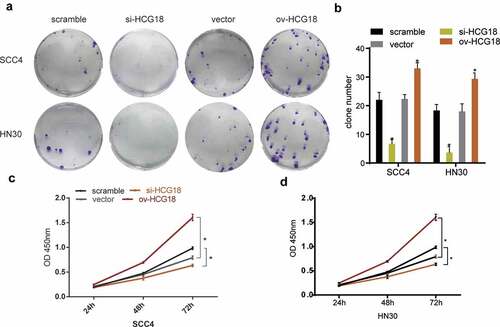
Figure 3. HCG18 facilitated cell migration and invasion of HNSCC. SCC4 and HN30 cells were transfected with silencing HCG18 siRNA (si-HCG18), scrambled siRNA, overexpressed plasmid (ov-HCG18) or vector plasmid for 48 h, respectively; (a) cell migration was measured using transwell assays at 24 h after transfection in SCC4 and HN30 cells respectively; (b) cell number was counted; (c) cell invasion was detected by wound healing assay in SCC4 and HN30 cells, respectively; (d) cell number was counted. Data represent the mean ± SD of at least triplicate independent experiments; *P < 0.05; **P < 0.01; ***P < 0.001.
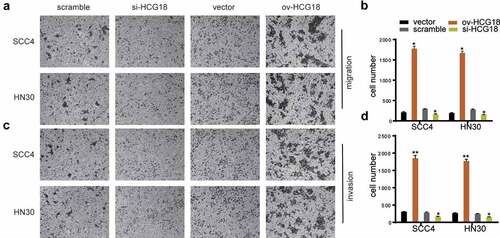
Figure 4. HCG18 promoted the tumorigenesis of HNSCC by Cyclin D1, and subsequentially activated the WNT signaling. (a) SCC4 cells was transfected with HCG18 overexpressed plasmid (ov-HCG18) or negative control plasmid, the expression of Cyclin D1 pulled down by HCG18 was detected by western blot assay; SCC4 and HN30 cells were transfected with silencing HCG18 siRNA (si-HCG18), scrambled siRNA, si-HCG18+ silencing Cyclin D1 siRNA (si-Cyclin D1) or si-HCG18+ Cyclin D1 overexpressed plasmid for 48 h, respectively. (b) the expression of AXIN2, β-catenin, c-Myc, Cyclin D1 and Survivin was evaluated. β-actin was used as the internal reference protein for normalization. (c) cell migration and invasion was measured using transwell assays at 24 h after transfection in SCC4 and HN30 cells and cell number was counted respectively; (d) cell number was counted. (D) viability of transfected SCC4 (left panel) and HN30 (right panel) cells was accessed by CCK8 assay. Data represent the mean ± SD of at least triplicate independent experiments; *P < 0.05; **P < 0.01; ***P < 0.001.
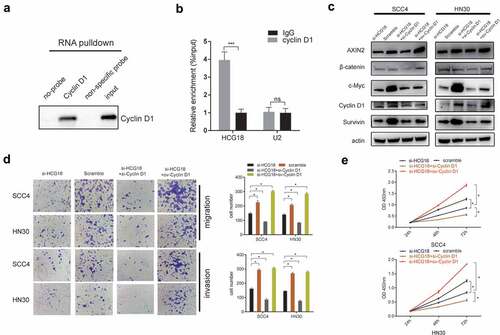
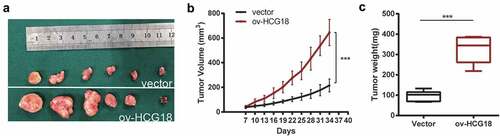
Figure 5. Upregulated HCG18 promoted the proliferation of HNSCC cells in vivo. HCG18 transfected cells or control vector of HN30 cells were implanted subcutaneously to the left upper flank of seven male mice. (a) tumors were excised and dissected six weeks later; (b) tumor volume was detected every 3 days after tumor formation; (c) tumor weight was detected. Data represent the mean ± SD of at least triplicate independent experiments; *P < 0.05; **P < 0.01; ***P < 0.001.