Figures & data
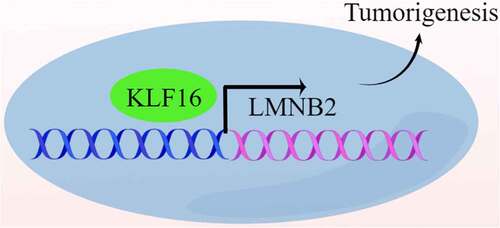
Table 1. The expression of KLF16 in lung cancer and normal tissues
Figure 1. Upregulation of KLF16 in lung cancer samples. (a) KLF16 expression in lung adenocarcinoma (LUAD, n = 526) and normal samples (n = 59) from The Cancer Genome Atlas. (b) Immunohistochemical staining results of KLF16 expression in LUAD and normal tissues. (c, d) RT-qPCR (c) and western blotting (d) analysis of KLF16 expression in normal (BEAS-2B) and three lung cancer cell lines (H1299, H1975, and A549). (e) The densitometric analysis corresponding to the western blotting. *P < 0.05; ***P < 0.001.
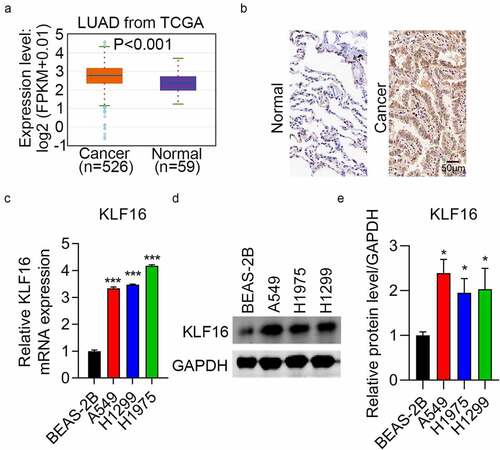
Figure 2. KLF16 knockdown inhibited the cell proliferation and migration. (a) Results of the western blotting of KLF16 levels in H1299 and H1975 cells transfected with siCtrl, siKLF16#1, and siKLF16#2. The loading control used was GAPDH. (b) Results of the CCK-8 analysis of the viability of H1299 and H1975 cells transfected with siCtrl, siKLF16#1, and siKLF16#2. (c) Results of the colony formation assay of H1299 and H1975 cells transfected with siCtrl, siKLF16#1, and siKLF16#2. (d) Results of the Transwell invasion analysis of H1299 and H1975 cells transfected with siCtrl, siKLF16#1, and siKLF16#2. *P < 0.05; **P < 0.01; ***P < 0.001.
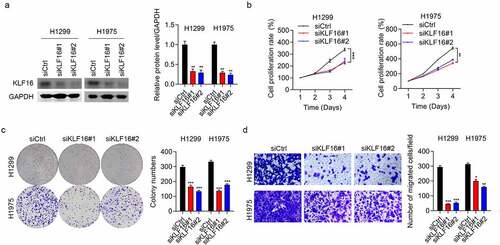
Figure 3. Overexpression of KLF16 promoted cell proliferation and migration. (a) Results of the western blotting of KLF16 levels of H1299 and H1975 cells treated with Ctrl and KLF16. The loading control was GAPDH. (b) Results of the CCK-8 analysis of the cell proliferation of H1299 and H1975 cells treated with Ctrl and KLF16. (c) Results of the colony formation assay of H1299 and H1975 cells treated with Ctrl and KLF16. (d) Results of the Transwell invasion analysis of H1299 and H1975 cells treated with Ctrl and KLF16. **P < 0.01; ***P < 0.001.
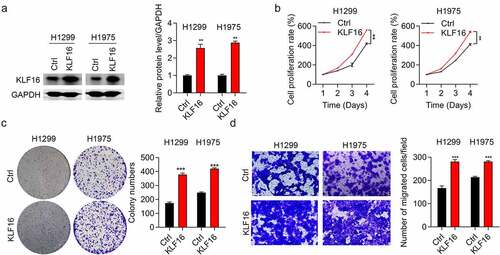
Figure 4. KLF16 regulated cell apoptosis and cell cycle. (a) Cell apoptosis of H1299 and H1975 cells transfected with siCtrl, siKLF16#1, and siKLF16#2 assessed by flow cytometry. (b) Cell cycle of H1299 and H1975 cells transfected with siCtrl, siKLF16#1, and siKLF16#2 assessed by flow cytometry. (c) Cell apoptosis of H1975 cells treated with Ctrl and KLF16. (d) Cell cycle of H1975 cells treated with Ctrl and KLF16. *P < 0.05; **P < 0.01; ***P < 0.001.
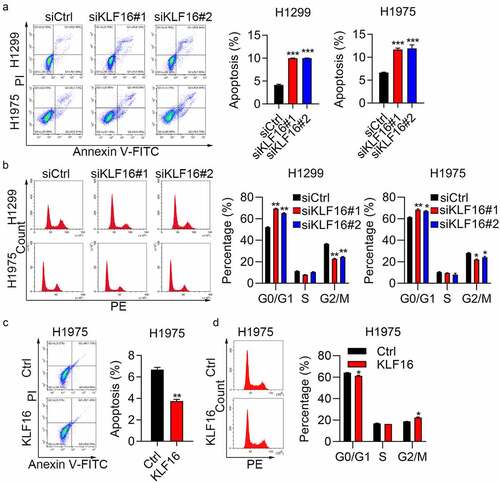
Figure 5. KLF16 regulates the expression of LMNB2. (a) Correlation between KLF16 and LMNB2 expression (R = 0.57, P < 0.001) in The Cancer Genome Atlas database. (b) LMNB2 expression in lung adenocarcinoma (n = 526) and normal tissues (n = 59). (c) Overall survival of patients with high LMNB2 and low LMNB2. (d) RT-qPCR of LMNB2 expression in siKLF16-transfected H1299 cells or KLF16-transfected H1975 cells. (e) Western blotting of LMNB2 expression in siKLF16-transfected H1299 cells or KLF16-transfected H1975 cells. The loading control used was GAPDH. (f) siCtrl or siKLF16 was co-transfected with pGL3-LMNB2 and pRLTK Renilla in H1299 and H1975 cells. Ctrl or KLF16 expressing vectors were co-transfected with pGL3-LMNB2 and pRLTK Renilla in BEAS-2B cells. Dual luciferase activity was checked by using Dual-Luciferase Reporter Assay System. **P < 0.01; ***P < 0.001.
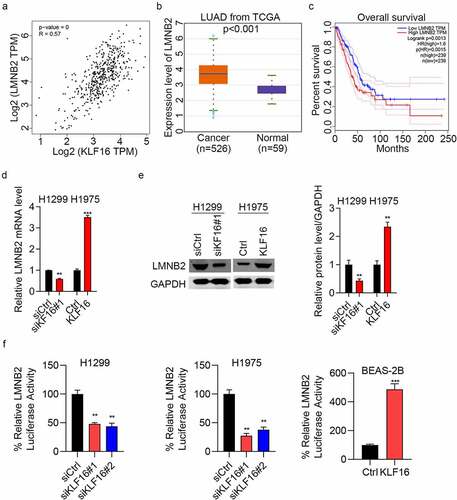
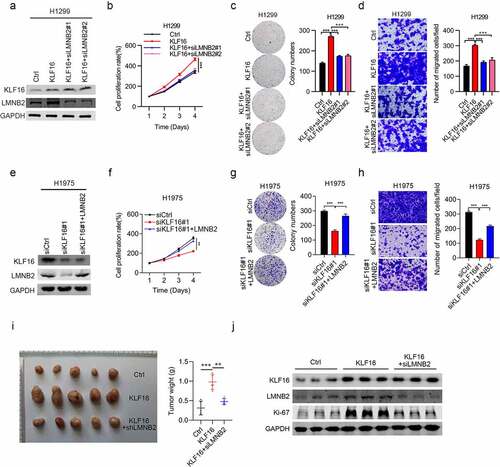
Figure 6. LMNB2 regulates cell progression. (a) Western blotting of KLF16 and LMNB2 expression in H1299 cells treated with Ctrl, KLF16, KLF16 + siLMNB2#1, and KLF16 + siLMNB2#2. (b-d) Cell viability (b), colony formation capacity (c) and cell migration (d) were measured in H1299 cells treated with Ctrl, KLF16, KLF16 + siLMNB2#1, and KLF16 + siLMNB2#2. (e) Western blotting of KLF16 and LMNB2 expression in H1975 cells transfected with siCtrl, siKLF16, and siKLF16 + LMNB2. (f-h) Cell viability (f), colony formation capacity (g) and cell migration (h) were measured in H1975 cells transfected with siCtrl, siKLF16, and siKLF16 + LMNB2. (i) Exogenously expressed Ctrl, KLF16, and KIF16+ shLMNB2 H1299 cells were injected in athymic nude mice (n = 5), and tumor formation was analyzed. Representative images and weight of xenografted tumors are shown. (j) Western blotting of KLF16 and LMNB2 expression in three xenografted tumor tissues. **P < 0.01; ***P < 0.001.