Figures & data
Figure 1. The effects of DDR1a knockdown and overexpression on cell proliferation. Two vectors targeted shDDR1a: LV3-DDR1a-homo-1733 , LV3-DDR1a-homo-1043 , and DDR1a overexpression (DDR1ahigh) were performed. LoVo cells were transfected with shDDR1a or DDR1a overexpression vector, LV3-DDR1a shRNA (LV3) or vec- DDR1ahigh were negative control. (a-c) Transfection efficiency of Lentivirus-mediated knockdown of DDR1a were investigated by Q-PCR and western blot. bp<0.01 compared with LV3. () Cell proliferation was determined using CCK-8 (d) and BrdU assay (e). ap < 0.05, bp<0.01, cp>0.05 compared with vec-shDDR1a or vec-DDR1ahigh.
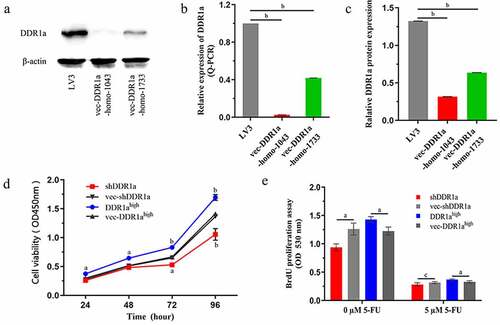
Figure 2. Knockdown DDR1a increases 5-FU sensitivity by inhibiting LoVo cell growth. Transfected cells were treated with 0–40 μM 5-FU for 24 h (a), 48 h (b), and 72 h (c), and the cytotoxicity was determined using CCK-8 assay. ap < 0.05, bp < 0.01 compared with vec-shDDR1a or vec-DDR1ahigh.
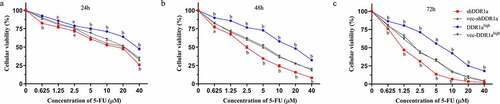
Table 1. The IC50 of 5-FU in LoVo cells
Figure 3. Effects of DDR1a knockdown and overexpression on apoptosis induced by 5-FU in LoVo cell. The apoptosis induced by 5-FU was determined using Hoechst 33,342 staining (2 μg/mL). Transfected cells were treated with 5 or 10 µM 5-FU for 48 and 72 h. The red arrows indicate normal cells and the white arrows indicate apoptotic cells. The cell fluorescence was detected by a fluorescence microscope (a, scale bar: 50 µm; ×20 magnification), and then image analysis was performed(b). bp<0.01, cp>0.05, compare with vec-shDDR1a or vec-DDR1ahigh.
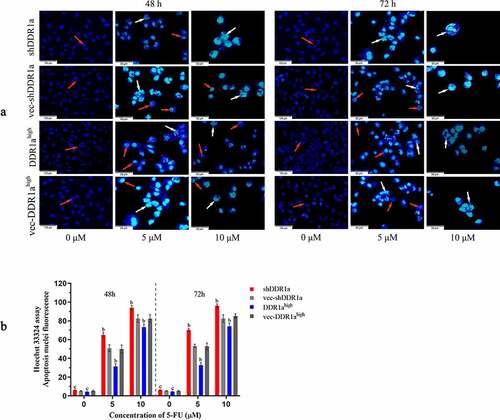
Figure 4. Effects of DDR1a knockdown and overexpression on apoptosis induced by 5-FU in LoVo cell. Transfected cells were treated with 5 and 10 µM 5-FU for 48 h, then the TUNEL assay was performed. The fluorescence intensity was detected by a fluorescence microscope (a scale bar: 50 µm; ×20 magnification), and was quantified by ImageJ software (b). bp<0.01, cp>0.05, compare with vec-shDDR1a or vec-DDR1ahigh.
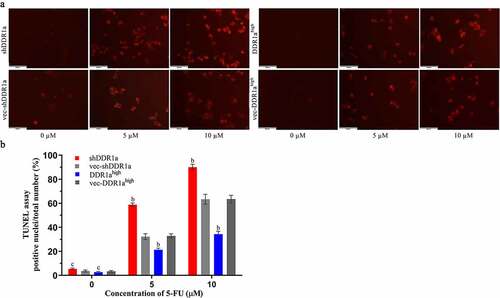
Figure 5. Knockdown DDR1a promotes 5-FU induced cytochrome C release and caspase-3 activation. (a) Cytochrome C release was determined by cytochrome C ELISA assay. (b) The caspase-3 activity assay in transfected cells. bp<0.01, cp>0.05, compare with vec-shDDR1a or vec-DDR1ahigh.
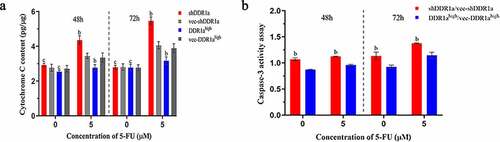
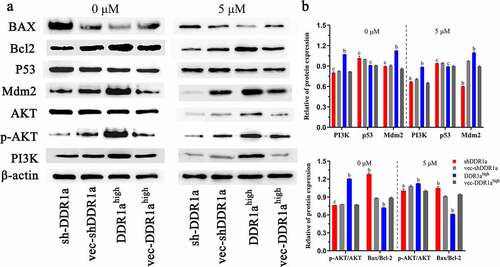
Figure 6. DDR1a regulated PI3K/AKT/Bcl2 signaling pathway (a) The transfected cells were treated with or without 5 μM 5-FU, then the Western blot was performed. (b) The bar chart represents the quantitative measurement of the relative proteins normalized with β-actin in three independent assays. ap < 0.05, bp<0.01, cp>0.05, compared with vec-shDDR1a or vec-DDR1ahigh. PI3K, phosphatidylinositol 3-kinase; p-AKT, phosphorylation protein kinase B; AKT, protein kinase B; MDM2, Murine double minute 2; Bcl-2, B-cell lymphoma/leukemia-2; BAX, Bcl-2 associated X.