
Figures & data
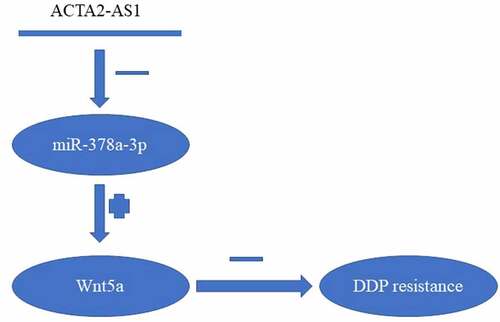
Table 1. Association between ACTA2-AS1 expression level and clinicopathological features of patients with OC
Table 2. The primer sequences included in this study
Figure 1. ACTA2-AS1 is up-regulated in DDP‑resistant OC cell lines and tissues (a) ACTA2-AS1 expression levels in tissues from OC patients (DDP-sensitive and DDP-resistant). (b) Kaplan-Meier survival curves for patients with DDP-sensitive and DDP-resistant. (c) Expression of ACTA2-AS1 in DDP-resistant cell lines. (d) CCK-8 assay of the viability and IC50 value of OC/DDP cells. (e) ACTA2-AS1 from the nuclear and cytoplasmic fractions of OC/DDP cells. (f) ROC curves of ACTA2-AS1. *p < 0.05.
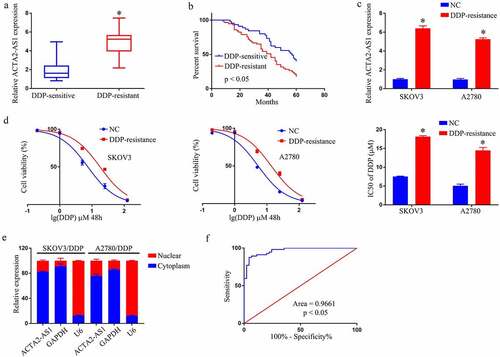
Figure 2. ACTA2-AS1 knockdown inhibits DDP resistance of OC/DDP cells in vitro. (a) RT-qPCR analysis of ACTA2-AS1 expression in OC/DDP cells. (b) CCK-8 assay of the viability and determination of IC50 value of OC/DDP cells following exposure to DDP as a series dose. *p < 0.05.
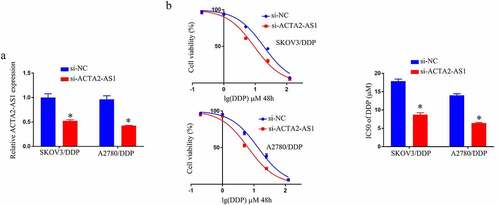
Figure 3. Silencing ACTA2-AS1 sensitizes OC cells to DDP by targeting miR-378a-3p. (a) For miR-378a-3p, ACTA2-AS1 is thought to act as a molecular sponge. (b) Luciferase assays in HEK293T cells co-transfected with mutant or wild-type ACTA2-AS1 and miR-378a-3p. (c) In HEK293T cells, anti-AGO2 RIP was conducted, followed by RT-qPCR for the detection of the expression of ACTA2-AS1 or miR-378a-3p linked to AGO2. (d) Expression of miR-378a-3p in DDP-resistant cell lines. (e) The effect of ACTA2-AS1 knockdown on the expression of miR-378a-3p in OC/DDP cells was investigated using RT-qPCR. (f) MiR-378a-3p expression levels in tissues from individuals suffering from OC (DDP-sensitive and DDP-resistant). (g) A negative correlation between ACTA2-AS1 expression and miR-378a-3p expression in DDP-resistant OC tissues. (h) RT-qPCR analysis of miR-378a-3p in OC/DDP cells transfected with NC inhibitor or miR-378a-3p inhibitor. (i) CCK-8 assay of the viability and determination of IC50 value of OC/DDP cells upon exposure to DDP as a series dose. *p < 0.05, nsp > 0.05.
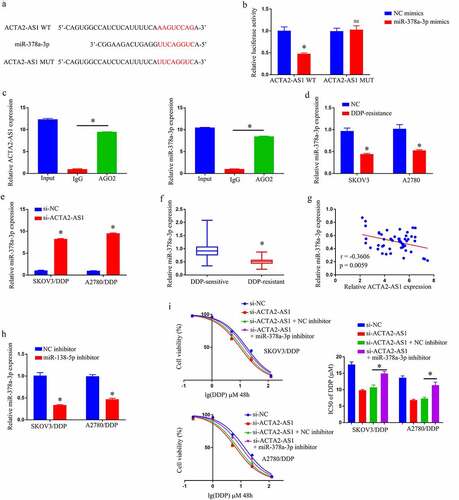
Figure 4. By targeting Wnt5a, MiR-378a-3p reduces DDP resistance in GC cells. (a) Wnt5a was predicted to function as a molecular sponge for miR-378a-3p. (b) Luciferase assays in HEK293T cells co-transfected with mutant or wild-type Wnt5a and miR-378a-3p. Expression of Wnt5a in DDP-resistant cell by RT-qPCR (c) and Elisa assay (d). Detection of expression of Wnt5a in OC/DDP cells that have been transfected with NC inhibitor, miR-378a-3p mimics, miR-378a-3p inhibitor, or NC mimics using RT-qPCR (e) and Elisa assay (f). (g) Wnt5a expression levels in tissues from OC patients (DDP-resistant and DDP-sensitive). (h) In DDP-resistant OC tissues, there is a negative connection between Wnt5a expression and miR-378a-3p expression. Expression detection of Wnt5a in OC/DDP cells transfected with si-NC or si-Wnt5a using RT-qPCR (i) and Elisa assay (j). (k) CCK-8 assay of the viability and determination of IC50 value of OC/DDP cells after exposure to DDP.as a series dose *p < 0.05, nsp > 0.05.
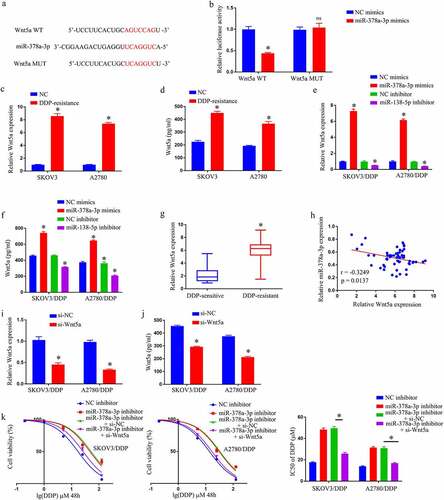
Figure 5. ACTA2-AS1 positively regulates Wnt5a through sponging miR-378a-3p. (a) Correlation analysis between ACTA2-AS1 and Wnt5a expression in DDP-resistant OC tissues. Expression detection of Wnt5a in OC/DDP cells using RT-qPCR (b) and Elisa assay (c). *p < 0.05.
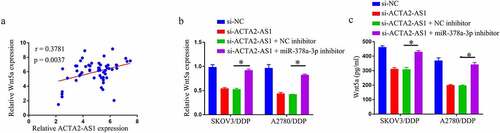
Figure 6. Summary of ACTA2-AS1/miR-378a-3p/Wnt5a axis.
