Figures & data
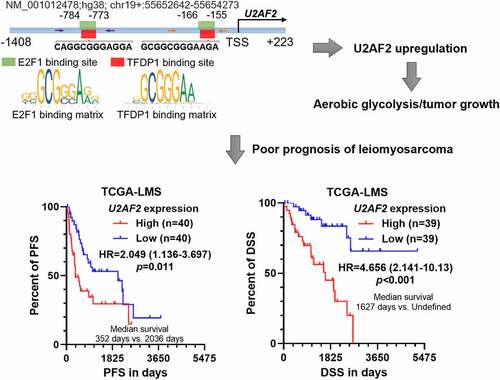
Figure 1. Leiomyosarcoma patients with high U2AF2 expression have a poor prognosis A. Comparison of U2AF2 mRNA expression between ULMS and STLMS cases in TCGA. B-C. K-M survival analysis was performed to explore the differences in PFS (b) and DSS (c) in leiomyosarcoma patients with high or low U2AF2 expression. D. Representative images of IHC staining was provided to show the expression and distribution of U2AF2 in leiomyosarcoma. Phosphate-buffered solution (PBS) (with primary anti-U2AF2) served as the negative control. E. Statistical summary of IHC staining results in 18 cases of primary leiomyosarcoma.
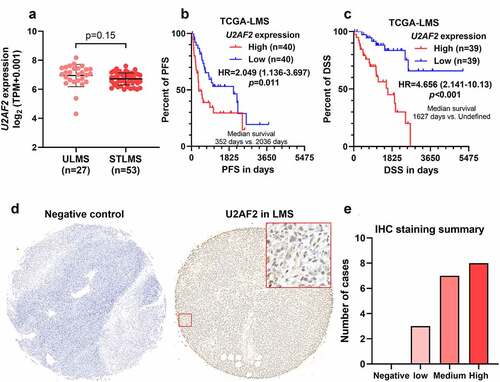
Figure 2. U2AF2 contributes to enhanced cell proliferation and aerobic glycolysis in leiomyosarcoma cells in vitro A-B. QRT-PCR analysis (a) and western blotting assays were conducted to detect the expression of U2AF2 at the mRNA and protein levels in SK-LMS-1 and SK-UT-1 cells 48 h after lentiviral mediated U2AF2 knockdown (n = 3). B-F. CCK-8 assay was performed to measure cell viability (b-c) and colony formation assay was conducted to assess colony formation capability (d-f) of SK-LMS-1 and SK-UT-1 cells with or without U2AF2 knockdown (n = 3). G-H. Glucose uptake (g) and lactate production (h) were measured in SK-LMS-1 and SK-UT-1 cells with or without U2AF2 knockdown by colorimetric analysis (n = 3). I-J. ECAR was measured in SK-LMS-1 and SK-UT-1 cells with or without U2AF2 knockdown (n = 5). Glu.: glucose; O.: Oligomycin. Data represent the mean ± SD. * comparison between NC and shU2AF1#1, #comparison between NC and shU2AF1#2; *p < 0.05, ## and **p < 0.01, ### and ***p < 0.001.
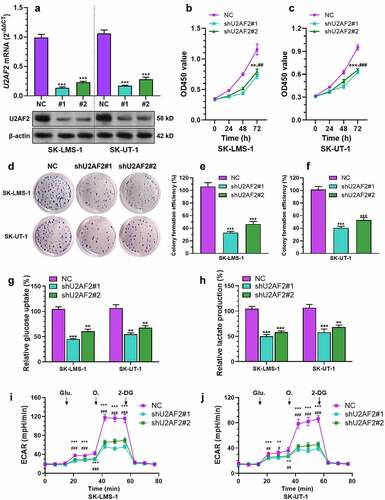
Figure 3. U2AF2 knockdown impairs leiomyosarcoma cell growth in vivo A. The xenograft tumors formed by U2AF2 knockdown (shU2AF2#1) or control vector (NC) SK-LMS-1 cells in nude mice models. B. The weight of the xenograft tumors in panel A. C-D. Representative images (c) and quantitation of Ki-67 positive tumor cells (d) in the xenograft tumors formed by SK-LMS-1 cells with or without U2AF2 knockdown. E. Schematic diagram of the aerobic glycolysis pathway. The enzymes and transporters that might be modulated by U2AF2 were marked by red arrows. F. Western blotting assays were conducted to detect the expression of U2AF2, GLUT1, HK2, PGK1, and PGAM1 in representative tumors (no. 1, 3 and 5 in panel A) formed by SK-LMS-1 cells with or without U2AF2 knockdown. **p < 0.01, ***p < 0.001.
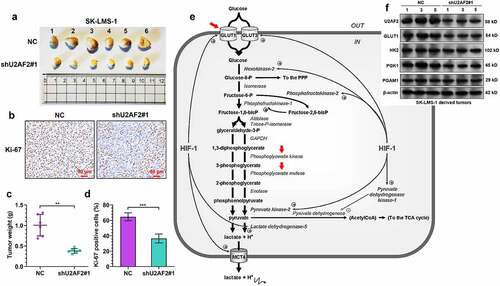
Figure 4. Bioinformatic analysis predicted a TFDP1/E2F1 complex that binds to the promoter of U2AF2 A. a heatmap showing the correlation between the expression of U2AF2 and the candidates TFs identified from CistroDB. B. A list of high potential candidate TFs modulating U2AF2 expression (Pearson’s r > 0.4). C. The high potential (relative score >0.85) binding site of TFDP1 (top panel) and E2F1 (bottom panel) in the promoter region of U2AF2. Promoter scanning was conducted using the Jaspar database. D. IF staining of TFDP1 (green) and E2F1 (red) in SK-LMS-1 and SK-UT-1 cells. E-F. Co-IP assays to assess the interaction between endogenous TFDP1 and E2F1 in SK-LMS-1 (e) and SK-UT-1 (f) cells. IP was performed using mouse anti-E2F1 or rabbit anti-TFDP1. IgG served as a negative control. Scale bar: 20 μm.
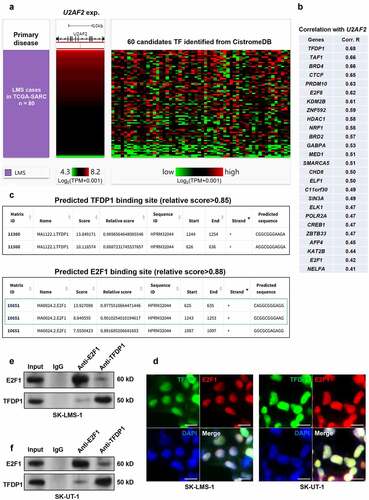
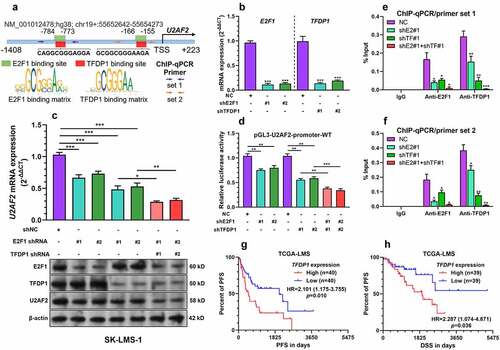
Figure 5. The TFDP1/E2F1 complex enhances U2AF2 transcription A. A schematic image showing the predicted binding site of TFDP1 and E2F1 in the promoter region of U2AF2. The positions of primers used for ChIP-qPCR assay were indicated by arrows. B. QRT-PCR was conducted to detect the expression of E2F1 and TFDP1 at the mRNA level in SK-LMS-1 cells 48 h after lentiviral mediated E2F1 or TFDP1 knockdown (n = 3). C. U2AF2 expression at the mRNA level (top panel) and E2F1, TFDP1, and U2AF2 expression at the protein level (bottom panel) in SK-LMS-1 cells 48 h after lentiviral mediated E2F1 or TFDP1 knockdown alone or in combination (n = 3). D. Relative luciferase activity of pGL3-U2AF2-promoter-WT in SK-LMS-1 cells with lentiviral mediated E2F1 or TFDP1 knockdown alone or in combination (n = 3). E-F. ChIP-qPCR assay was performed to quantify the relative enrichment of U2AF2 promoter fragments (by primer sets indicated in panel A) in the ChIP samples immunoprecipitated by anti-E2F1 or anti-TFDP1 in the lysates of SK-LMS-1 cells with E2F1 or TFDP1 knockdown alone (shE2#1 or shTF#1) or in combination (shE2#1 and shTF#1) (n = 3). G-H. K-M survival analysis was performed to explore the differences in PFS (g) and DSS (h) in leiomyosarcoma patients with high or low TFDP1 expression. *p < 0.05, **p < 0.01, ***p < 0.001. ShE2: shE2F1, ShtTF: shTFDP1.