Figures & data
Figure 1. Differentially expressed genes screened between synovial tissue in osteoarthritis (OA) and normal control from GSE82107 (a, e), GSE55235 (b, f), GSE55457 (c, g) and GSE169077 (d, h) using volcano plot and heatmap. (a) 829 were upregulated and 2269 were down-regulated in GSE82107, (b)1655 were upregulated and 1014 were down-regulated in GSE55235, (c) 792 were upregulated and 1289 were down-regulated in GSE55457,(d) 469 were upregulated and 231 were down-regulated in GSE169077.The cutoff criteria were p < 0.05 and |log2 fold change (FC)| >0.5. Yellow, red, and blue dots represent downregulated, upregulated, and unchanged genes, respectively.
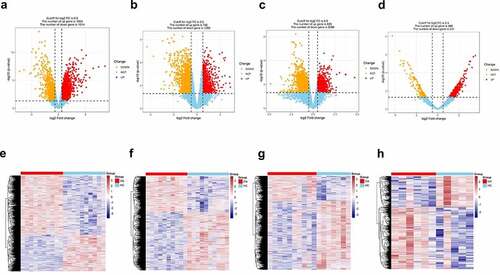
Figure 2. Venn diagram of shared differentially expressed genes screened between synovial tissue in OA and normal control from GSE82107, GSE55235, GSE55457. 106 shared differentially expressed genes from GSE82107, GSE55235, GSE55457. Blue circle represents GSE82107, yellow circle represents GSE55235, and green circle represents GSE55457.
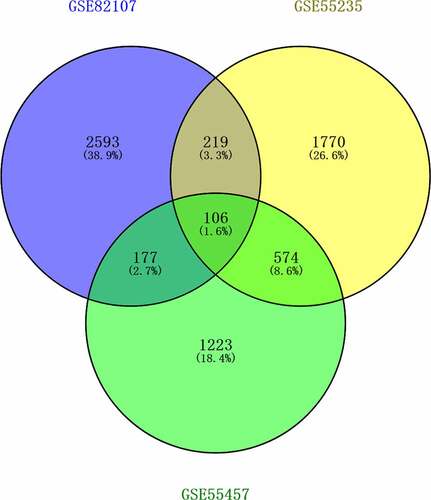
Figure 3. Bubble plots of Kyoto Encyclopedia of Genes and Genomes (KEGG) enrichment and Gene Ontology (GO) analysis of differentially expressed genes (DEGs). The KEGG enrichment and GO analysis of the shared DEGs from GSE82107, GSE55235, GSE55457 were shown in a, b. The KEGG enrichment and GO analysis of DEGs from GSE169077 were shown in c, d. The color indicates the p-value (from the lowest in blue to the highest in red), and the bubble size indicates the number of genes. The rich factor represents the proportion of the total number of genes.
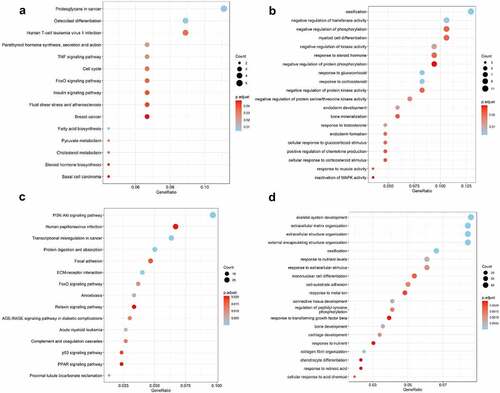
Figure 4. Visualization of the interaction networks of Resolvin D1 (RvD1)-targeted genes and chemicals constructed using Cytoscape. RvD1 targeted genes including: IL8, TRPA1, PTGS2, MYOF, FER1L6, GPR32, FPR2, DYSF, OTOF, RELA, CXR2, CXR1, TP53, NFKB1, AITC, DARC. The Orange circles represent the level of protein-protein interactions with RvD1. The luminous yellow circles and the blue circles represent the protein‐chemical interactions. Edges indicate interactions between circles.
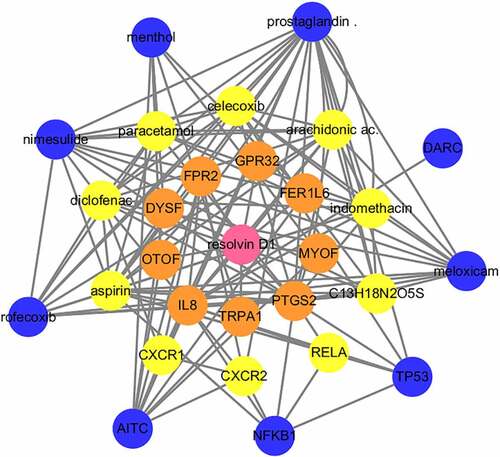
Figure 5. Venn diagram of identical shared KEGG pathways of RvD1‐targeted genes and OA related genes. Here, 37 RvD1‐targeted genes were related to KEGG pathways, 135 were human OA‐related KEGG pathways from synovial tissue and 297 were human OA‐related KEGG pathways from cartilage. There were 27 (8.9%) shared KEGG pathways.
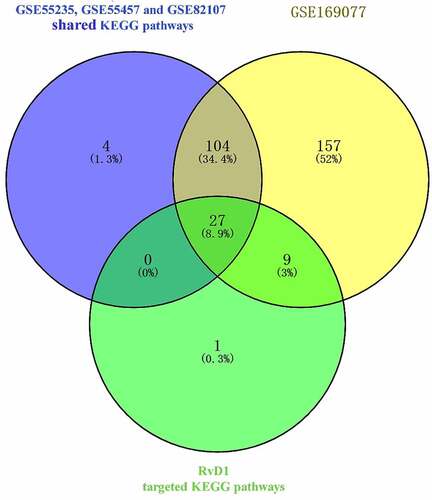
Table 1. The top four shared Kyoto Encyclopedia of Genes and Genomes (KEGG) pathways of differentially expressed genes of osteoarthritis and RvD1 targeted genes
Figure 6. Identification of cultured chondrocytes. (a) Optical microscopy of cultured chondrocytes (400x). (b) Toluidine blue staining of cultured chondrocytes (400x). (c) Immunofluorescence staining for type-II collagen (green) and 4′,6-diamidino-2-phenylindole (blue) (400x), the scale bar is 20 μm.
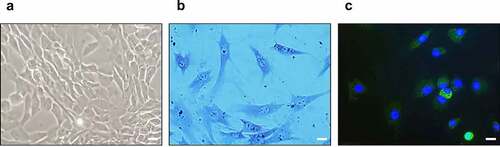
Figure 7. The results of Annexin v- FITC /PI. (a) Chondrocyte apoptosis following DMEM/F12 treatment. (b) Chondrocyte apoptosis following IL‐1β treatment. (c) Chondrocyte apoptosis following RvD1+ IL-1β treatment. (d) Chondrocyte apoptosis following PDTC+IL‐1β treatment. (e) The analysis results for the percentage of apoptosis among the four groups. **p < 0. 01.
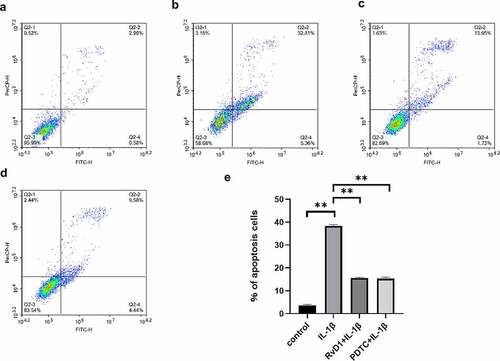
Figure 8. The result of qRT‐PCR of proinflammatory cytokines in IL-1β-treated chondrocytes. Cells were incubated with DMEM/F12, IL‐1β, RvD1+ IL-1β, and PDTC+IL‐1β; the total RNA was collected. RvD1 and PDTC inhibited the gene expression of (a) TNF-α and (b) IL‐8. All experiments were repeated three times. *p < 0.05, **p < 0. 01.
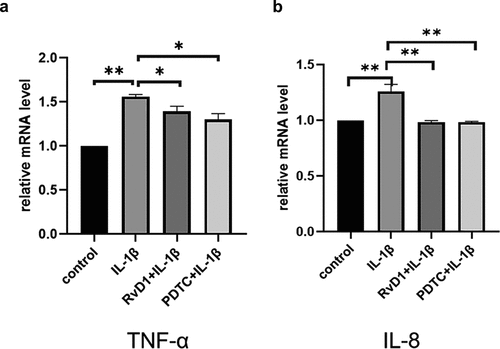
Figure 9. The result of enzyme-linked immunosorbent assay (ELISA) of proinflammatory cytokines in IL-1β-treated chondrocytes. Cells were incubated with DMEM/F12, IL‐1β, RvD1+ IL-1β, and PDTC+IL‐1β. The levels of (a) TNF-α and (b) IL‐8 were assessed with the ELISA kit. RvD1 and PDTC decreased the level of TNF-α and IL‐8. All experiments were repeated three times. **p < 0.01.
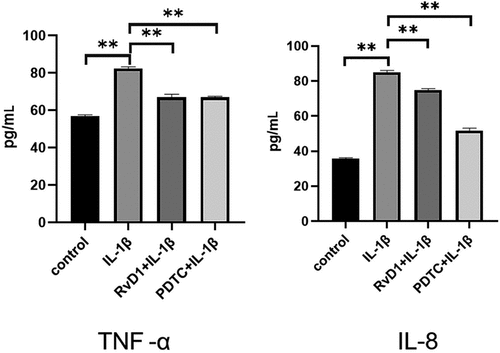
Figure 10. RvD1 inhibits the activation of NF‐κB signaling pathway in IL-1β induced chondrocytes. The results of western blotting of (a) nuclear p65 and (b) total p65. RvD1 and PDTC were shown to decrease the expression of nuclear p65. All experiments were repeated three times. **p < 0.01, ns indicates no significant difference.
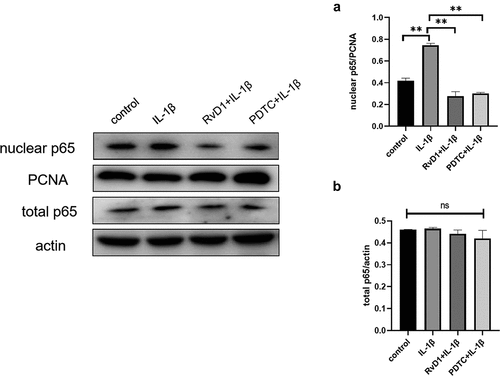
Figure 11. RvD1 inhibits chondrocytes apoptosis via p53 signaling pathway. The results of western blotting of (a) p53 and (b) Bax. RvD1 and PFTα were shown to decrease the expression of nuclear p53 and Bax. All experiments were repeated three times. *p < 0.05, **p < 0.01.
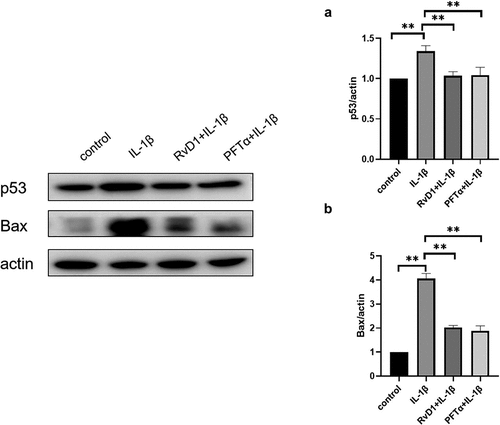
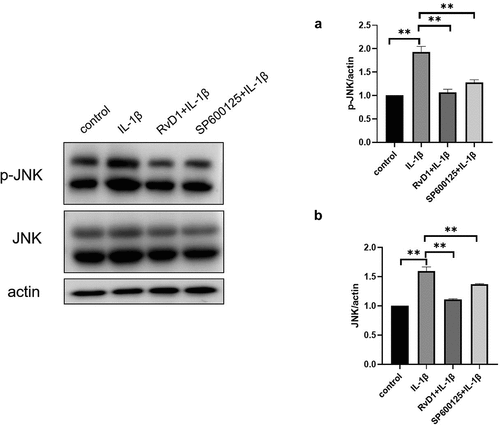
Figure 12. RvD1 inhibits the activation of MAPK/JNK signaling pathway. The result of western blotting of (a) p-JNK and (b) JNK. RvD1 and SP600125 were shown to decrease the expression of p-JNK. All experiments were repeated three times. **p < 0.01.