
Figures & data

Figure 1. CAB39 was down-regulated in a mouse OA model.
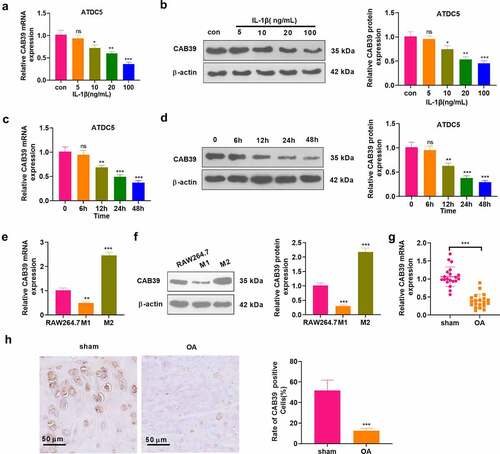
Figure 2. Overexpression of CAB39 facilitated M1 to M2 polarization of macrophages and attenuated IL-1β-mediated chondrocyte injury.
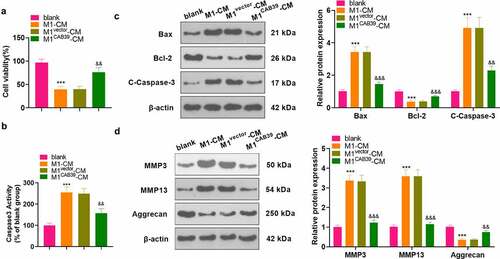
Figure 3. Knockdown of CAB39 curbed the M2 phenotype of macrophages and enhanced IL-1β-mediated chondrocyte injury.
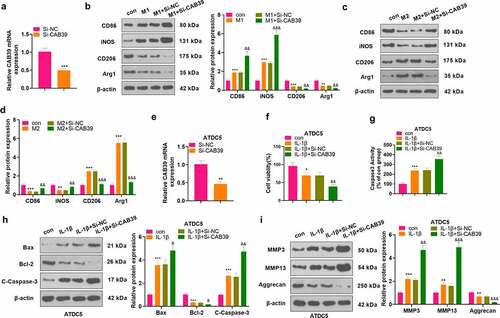
Figure 4. Overexpressing CAB39 alleviated chondrocyte injury induced by macrophages.
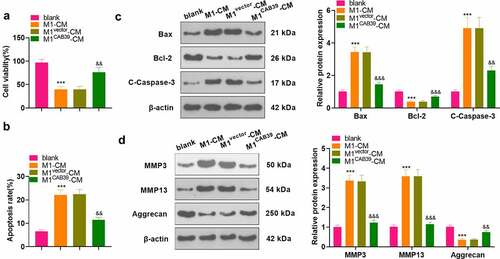
Figure 5. Overexpressing CAB39 motivated the AMPK/Sirt-1 pathway.
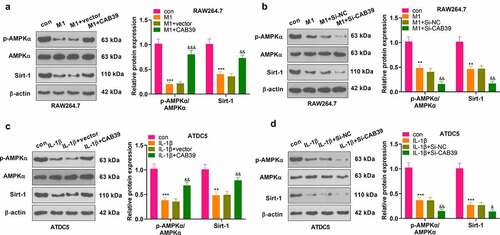
Figure 6. Inhibition of the AMPK/Sirt-1 pathway attenuated CAB39’s promoting effect on the M2 phenotype of macrophages and its protective effect on chondrocytes.
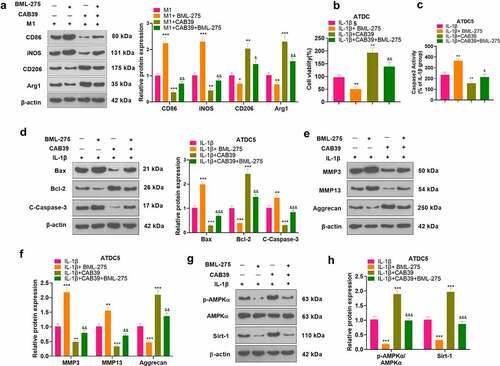
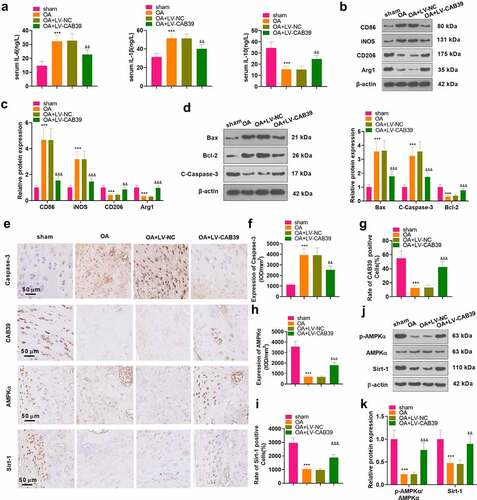
Figure 7. Overexpressing CAB39 eased cartilage damage and inflammation in DMM mice.
Data availability statement
The data sets used and analyzed during the current study are available from the corresponding author on reasonable request.