
Figures & data

Figure 1. lncRNA-SNHG7 and miR-499a expression in rat and in vitro SCI models. Reverse transcription-quantitative PCR assay was carried out to determine the expression levels of (a and b) SNHG7 and (c and d) miR-449a in SCI rats and SCI in vitro cells models. **P < 0.01 vs. the NC group. lncRNA-SNHG7, long non-coding RNA-small nucleolar RNA host gene 7; miR-499a, microRNA-499a; SCI, spinal cord injury.
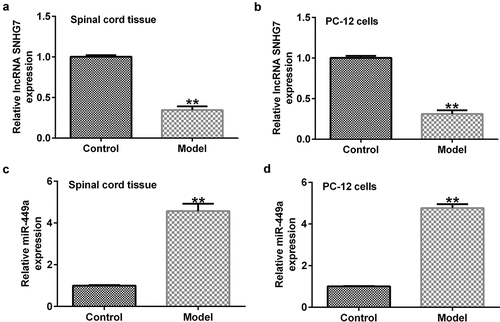
Figure 2. lncRNA-SNHG7 negatively regulates miR-499a expression in PC-12 cells. SNHG7 plasmid, control plasmid, miR-449a mimics, mimics control, lncRNA-SNHG7 plasmid + mimics control or lncRNA-SNHG7 plasmid + miR-449a mimics were transfected into PC-12 cells for 48 h. (a-c) lncRNA-SNHG7 and miR-449a levels in different groups were determined by qRT-PCR. * P < 0.05, **P < 0.01 vs. control.
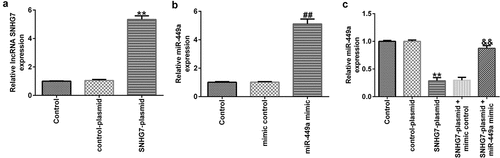
Figure 3. miR-499a abolishes the influences of lncRNA-SNHG7 in a cell model of SCI. PC-12 cells were transfected with lncRNA-SNHG7 plasmid, control plasmid, lncRNA-SNHG7 plasmid + mimics control or lncRNA-SNHG7 plasmid + miR-449a mimics for 48 h and were then treated with 100 ng/ml lipopolysaccharide for 4 h. Cell viability, apoptosis, and the secretion of inflammatory cytokine were determined using MTT (a), flow cytometry analysis (b and c), and ELISA assay (d-f), respectively. * P < 0.05, **P < 0.01 vs. control.
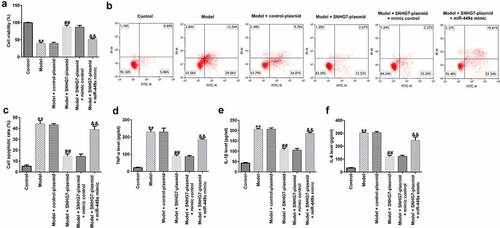
Figure 4. TNIP2 expression in rat and in vitro SCI models. (a) A schematic of TNIP2 binding site in miR-499a 3’-UTR. (b) The interaction between miR-449a and TNIP2 were verified using dual-luciferase reporter assay. (c and d) qRT-PCR analysis of TNIP2 in rat and in vitro SCI models. * P < 0.05, **P < 0.01 vs. control.
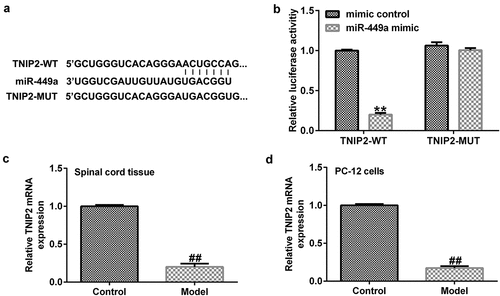
Figure 5. miR-449a negatively regulates TNIP2 expression in PC-12 cells. miR-449a inhibitor, inhibitor control, control-siRNA or si-TNIP2 were transfected into PC-12 cells for 48 h. (a) miR-449a expression in different groups was determined using RT-qPCR. (b and c) TNIP2 mRNA expression in different groups was determined using RT-qPCR. (d) Western blot analysis of TNIP2 protein expression. * P < 0.05, **P < 0.01 vs. control.
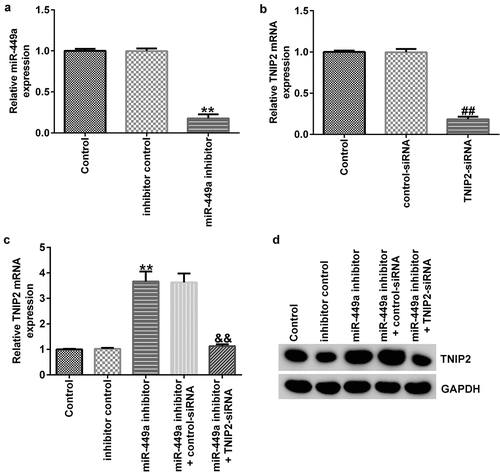
Figure 6. TNIP2 silencing abolishes the effects of miR-449a inhibitor in SCI. PC-12 cells were transfected with miR-449a inhibitor, inhibitor control, control-siRNA or si-TNIP2 for 48 h, and treated with 100 ng/ml lipopolysaccharide for an additional 4 h. Subsequently, cell viability, apoptosis, and secretion of inflammatory cytokines were determined using MTT assay (a), flow cytometric analysis (b and c), and ELISA assay (d-f), respectively. * P < 0.05, **P < 0.01 vs. control.
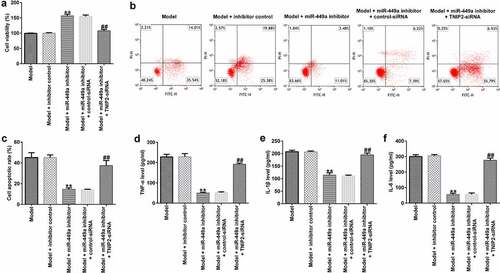
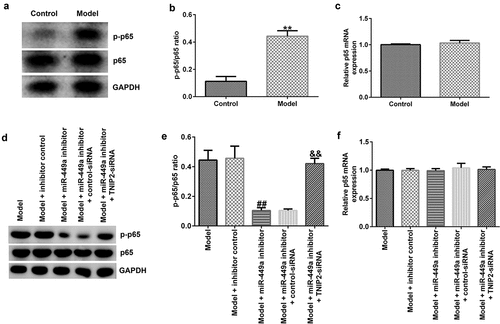
Figure 7. NF-κB pathway activation in SCI model in vitro. PC-12 cells were transfected with miR-449a inhibitor, inhibitor control, control-siRNA or si-TNIP2 for 48 h, and stimulated with 100 ng/ml lipopolysaccharide for 4 h. (a) Determination of p-p65 and p65 protein expression using western blot assay. (b) p-p65/p65 ratio. (c) RT-qPCR analysis of p65 mRNA levels. (d) Determination of p-p65 and p65 protein expression using western blot assay. (e) p-p65/p65 ratio. (f) p65 mRNA expression was measured using RT-qPCR. * P < 0.05, **P < 0.01 vs. control.
Data availability statement
The datasets used and/or analyzed during the current study are available from the corresponding author on reasonable request.