Figures & data
Figure 1. TGF-β1 secreted by M2 macrophages promotes the proliferation and invasion of HCC cells. (a) CD206 expression of THP-1 after treatment with PMA and IL-4/13 was analyzed by FCM. (b) TGF-β1 secretion in mono-culture medium of M2 macrophages and HCC (HepG2 and Huh7) cells and in co-culture medium of M2/HepG2 and M2/Huh7 detected by an ELISA kit. (c) The mRNA and (d) protein expression of TGF-β1 in M2 macrophages, HepG2 cells, and Huh7 cells before and after co-culture was assessed by RT-qPCR and Western blot, respectively. HepG2 and Huh7 cells were cultured with different treatments as follows: mono-culture (used as the control group), co-culture, TGF-β1 treatment, co-culture + TGF-β1Ab pretreatment, and their (e) proliferation and (f) invasion were analyzed using Edu and transwell assays, respectively. **P < 0.01 and ***P < 0.005, vs. M2 or mono-culture or control; ###P < 0.005, vs. co-culture. Scale bar = 100 μm.
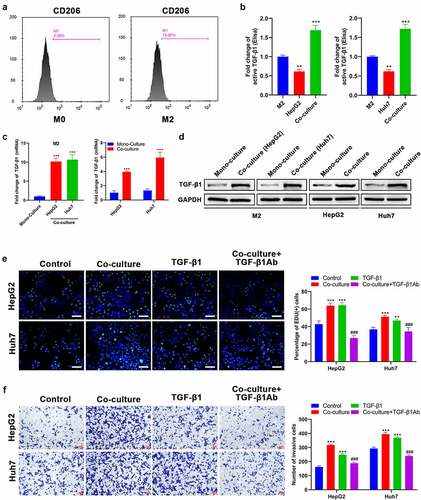
Figure 2. Emodin suppresses the viability of M2 macrophages and HepG2 cells and induces the transformation of M2 to M1 macrophages. (a) Effect of emodin (0, 25, 50, 100, and 150 μM) on the viability of M2 macrophages, HepG2 cells, and Huh7 cells for 24 h. Effect of emodin (0, 25, 50, 100, and 150 μM) on the (b-c) invasion, (d) TGF-β1 mRNA expression, and (e) TGF-β1 protein levels of HepG2 and Huh7 cells for 24 h. M2 macrophages were treated with 0, 25, and 50 μM emodin for 24 h, and (f) CD206 and CD86 expression of M2 macrophages was analyzed by FCM; (g) The protein and (h) mRNA expression of Arg1, TGF-β1, IL-10, iNOS, and TNF-α in M2 macrophages was assessed by Western blot and RT-qPCR, respectively. *P < 0.05, **P < 0.01, and ***P < 0.005, vs. 0 μM.
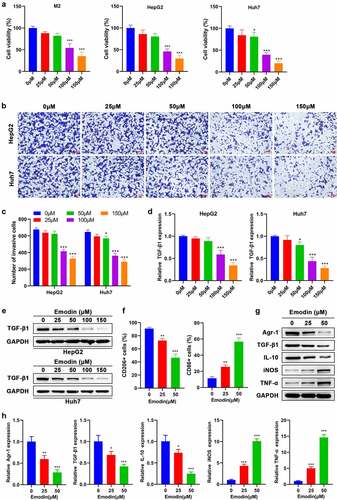
Figure 3. Emodin reverses the effect of promoting the proliferation and invasion of HepG2 cells induced by co-culturing with M2 macrophages. M2 macrophages were treated with 0, 25, and 50 μM emodin, and then co-cultured with HepG2 cells. The (a) proliferation and (b) invasion of HepG2 cells were determined using Edu and transwell assays. *P < 0.05, **P < 0.01, and ***P < 0.005, vs. 0 μM. Scale bar = 100 μm.
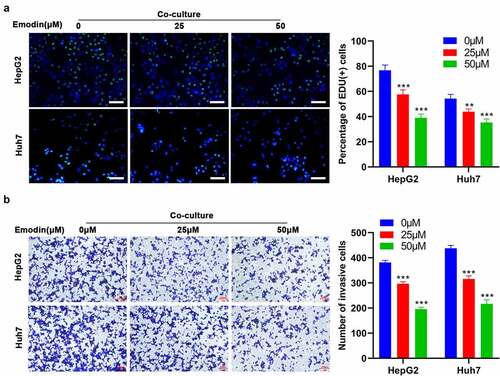
Figure 4. miR-26a contributes to the transformation of M2 to M1 macrophages and directly targets TGF-β1. (a) The expression levels of miR-320a, miR-125a, miR-26a, and miR-21 in M2 macrophages were assessed by RT-qPCR. (b) The expression of miR-26a in M2 macrophages with the transfection of miR-26a mimics, inhibitors, or their corresponding NC. After transfected by miR-26a or NC inhibitors, M2 macrophages were treated with 0 and 50 μM emodin, and (c) the mRNA expression of Arg1, TGF-β1, IL-10, iNOS, and TNF-α in M2 macrophages was assessed by RT-qPCR. (d) The predicted binding sites of miR-26a with TGF-β1. (e) Relative luciferase activity in TGF-β1 wild type and mutant cells with miR-26a mimics was evaluated by dual-luciferase reporter assay. After transfected by miR-26a or NC mimics, M2 macrophages were treated with 0 and 50 μM emodin, and (f) the protein levels of TGF-β1 in M2 macrophages were detected by Western blot. *P < 0.05, **P < 0.01, and ***P < 0.005, vs. 0 μM or NC mimics or NC inhibitors.
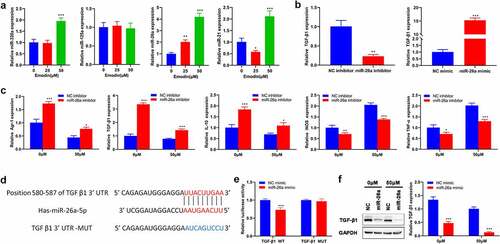
Figure 5. Down-regulated miR-26a blocks the effect of emodin on the proliferation and invasion of HepG2 cells from co-culture system by suppressing TGF-β1 and Akt activation. The co-culture systems formed by HepG2 cells and M2 macrophages were divided into four groups with different treatments (co-culture group: HepG2 cells were co-cultured with M2 macrophages without any treatment; co+Emodin group: under the treatment of emodin, HepG2 cells were co-cultured with M2 macrophages; co+Emodin+inhibitor group: under the treatment of emodin, HepG2 cells were co-cultured with M2 macrophages transfected by miR-26a inhibitors; co+Emodin+inhibitor+ TGF-β1Ab group: identical treatment to the co+Emodin+inhibitor group except a pretreatment of TGF-β1Ab. (a) The proliferation and (b) invasion of HepG2 cells were analyzed by Edu and transwell assays, respectively. (c) The protein levels of TGF-β1, Akt, and phosphorylated Akt were analyzed by Western blot. ***P < 0.005, vs. co-culture group; ###P < 0.005, vs. co+emodin group; &&&P < 0.005, vs. co+emodin+inhibitor group. Scale bar = 100 μm.
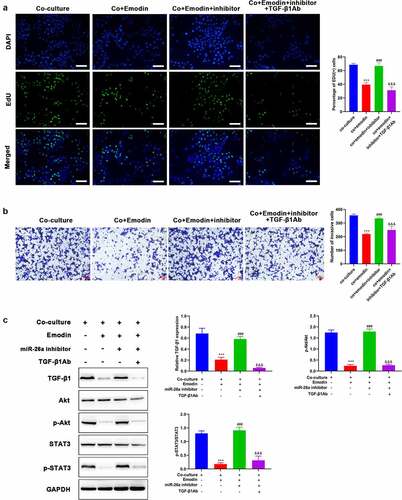
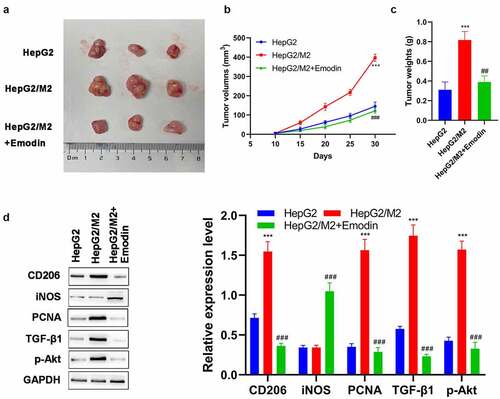
Figure 6. Emodin suppresses tumor growth and promotes the polarization of M2 to M1 macrophages in HCC in vivo. (a) The representative image, (b) growth curve, and (c) weight of xenografts collected from HepG2, HepG2/M2, and HepG2/M2+ emodin groups. (d) The protein expression of CD206, iNOS, PCNA, TGF-β1, and p-Akt in xenografts was detected by Western blot. ***P < 0.005, vs. HepG2 group; ###P < 0.005, vs. HepG2/M2 group.