Figures & data
Figure 1. PGM5-AS1 located in cytoplasm was downregulated in CC. (a) GEPIA displayed the expression of PGM5-AS1 in human cancers. CESC, cervical squamous cell carcinoma and endocervical adenocarcinoma. (b) qRT-PCR detected the expression of PGM5-AS1 in clinical CC tissues and adjacent normal tissues. (c) qRT-PCR detected the expression of PGM5-AS1 in CC cell lines (HeLa and CaSki) and human immortalized epidermal cell line HaCaT. **P < 0.001 vs. HaCaT. (d) Subcellular fractionation assay identified the location of PGM5-AS1 in CC cells. (e) qRT-PCR identified the transfection efficiency of pcDNA-PGM5-AS1 in CC cells. **P < 0.001 vs. pcDNA3.1.
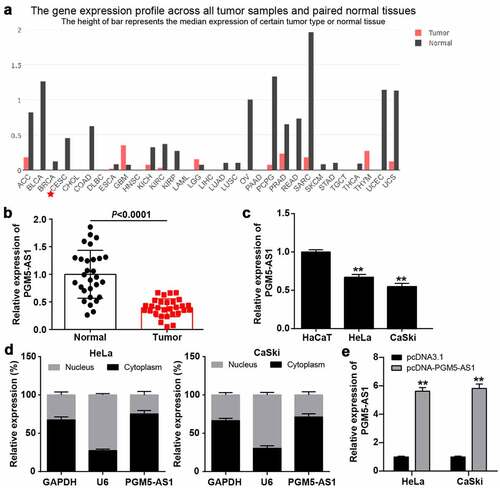
Figure 2. PGM5-AS1 overexpression suppressed CC cell malignancy. (a) EDU assay identified the change of cell proliferation in CC cells after transfecting with pcDNA-PGM5-AS1 vectors. (b) Wound healing assay measured the change of migration rate in CC cells after transfecting with pcDNA-PGM5-AS1 vectors. (c) Transwell assay verified the change of the number of invaded cells in CC cells after transfecting with pcDNA-PGM5-AS1 vectors. **P < 0.001 vs. pcDNA3.1.
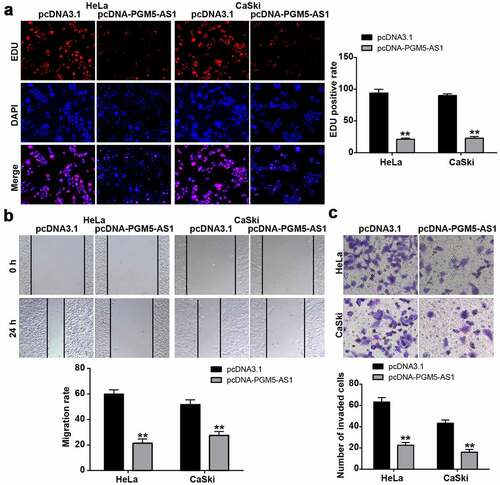
Figure 3. miR-4284/DCN axis might be the downstream of PGM5-AS1 in CC. (a) GO enrichment of 393 downregulated genes in CC was analyzed by Metascape. (b) Eight genes associated with wounding and cell migration were screened out. (c) The expression of eight genes in cervical squamous cell carcinoma was analyzed according to TCGA database including 3 normal samples and 305 tumor samples. Red, high expression in samples. Blue, low expression in samples. (d-f) qRT-PCR identified the expression of APOD, PTN and DCN in clinical CC tissue samples and adjacent normal samples. (g) A total of 11 miRNAs were overlapped from miRDB and miRWalk. miRDB was applied to predict the miRNAs binding to PGM5-AS1. miRWalk was applied to predict the miRNAs binding to PTN. (h) RNA pull-down assay identified the DNC enrichment in eleven miRNAs groups. Bio, biotinylated. NC, negative control. **P < 0.001 vs. Bio-NC. (i) qRT-PCR identified the expression of miR-4284 in clinical CC tissue samples and adjacent normal samples. (j-k) Pearson correlation analysis identified the negative correlation between miR-4284 expression and PGM5-AS1/DCN expression in clinical CC tissues.
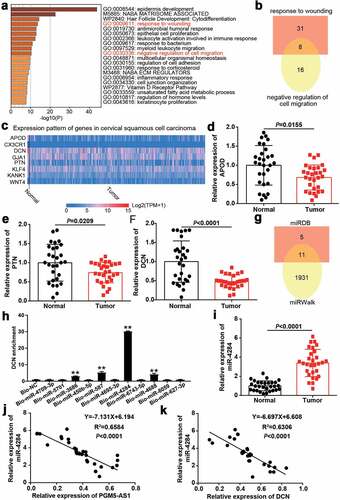
Figure 4. PGM5-AS1 upregulated DCN expression by sponging miR-4284 in CC cells. (a) The binding site between PGM5-AS1 and miR-4284. (b) qRT-PCR identified the transfection efficiency of miR-4284 mimic in CC cells. mimic, miR-4284 mimic. **P < 0.001 vs. mimic-NC. (c) The luciferase assay measured the luciferase activity in transfected CC cells. WT, wild type. MUT, mutant. mimic, miR-4284 mimic. **P < 0.001. (d) The binding site between DCN and miR-4284. (e) The luciferase assay measured the luciferase activity in transfected CC cells. WT, wild type. MUT, mutant. mimic, miR-4284 mimic. **P < 0.001. (f) Western blotting detected the expression of DCN protein in transfected CC cells. mimic, miR-4284 mimic. **P < 0.001.
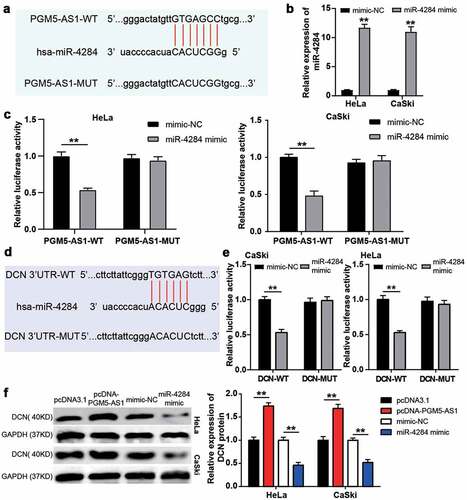
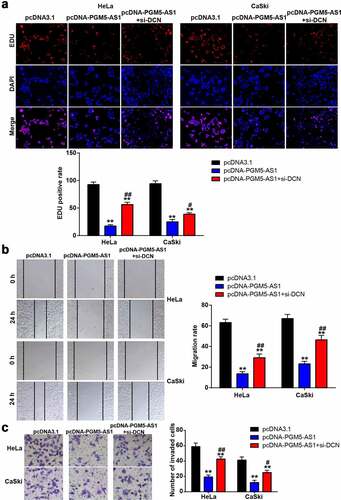
Figure 5. DCN knockdown improved the negative effect of PGM5-AS1 overexpression on CC cells. (a) EDU assay identified the change of cell proliferation in transfected CC cells. (b) Wound healing assay measured the change of migration rate in transfected CC cells. (c) Transwell assay verified the change of the number of invaded cells in transfected CC cells. **P < 0.001 vs. pcDNA3.1. #P < 0.05, ##P < 0.001 vs. pcDNA-PGM5-AS1.