Figures & data
Figure 1. Macroscopic and histological evaluation of EF. (a) The count of fibroblasts in epidural fibrosis area decreased in a dose-dependent manner in images of H&E staining (magnification, ×400). (b) Representative images of Masson staining and the OD value of collagen (magnification, ×400).Quercetin inhibited epidural collagen synthesis in a dose-dependent manner.Intra articular collagen appeared blue. (c,d) Representative images of Masson staining and the relative levels of collagen I and collagen III (magnification, ×400). (*Compared with Control group, P < 0.05; #Compared with 100 mg/kg group, P < 0.05).
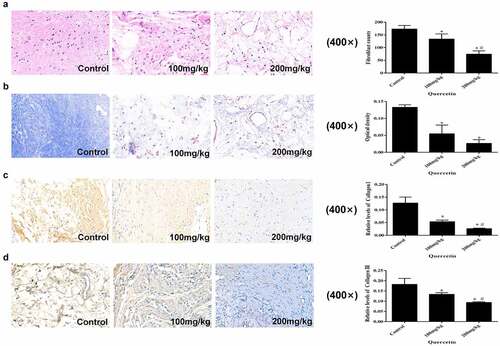
Figure 2. Immunohistochemical staining of LC3 and p-mTOR in epidural fibrosis tissues. (a, c) LC3 immunohistochemistry staining results showed that quercetin treatment reduced the number of LC3-expressing cells in a dose-dependent manner in rats(magnification, ×400). (b. d) p-mTOR immunohistochemistry staining results showed that quercetin treatment reduced the number of p-mTOR-expressing cells in a dose-dependent manner in rats(magnification, ×400). (*Compared with Control group, P < 0.05; #Compared with 100 mg/kg group, P < 0.05).
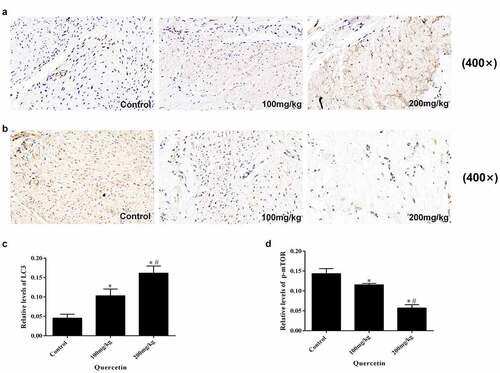
Figure 3. Quercetin inhibited fibroblast proliferation in vitro. (a) CCK-8 showed that the viability of fibroblasts decreased with the increase in quercetin concentration .(b) CCK-8 showed that the viability of fibroblasts was found to decrease with time in a time-dependent manner after the treatment with 20 μmol/L quercetin (c)Edu staining showed that the number of positive cells decreased significantly after the treatment with 20 μmol/L quercetin for 24 h . (d) The proteins levels of PCNA and Cyclin D1 decreased in a concentration dependent manner treated with quercetin .β-actin was used as a control.
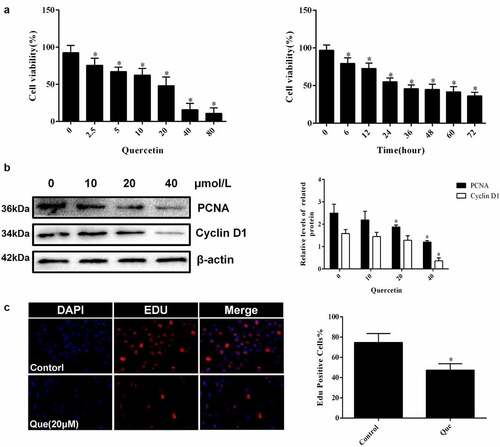
Figure 4. Quercetin induced fibroblast apoptosis in vitro. (a, b) Fibroblast apoptosis was analyzed by TUNEL staining for fibroblasts cultured with quercetin *p < 0.05 versus the control group. (c-e) The proteins levels of cleaved-PARP and Bax treated with different concentrations of quercetin. β-actin was used as a control.
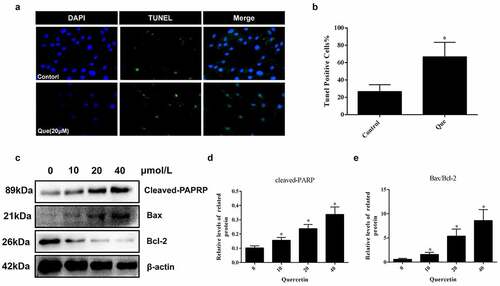
Figure 5. The influence of quercetin on fibroblasts differentiation and the expression of extracellular matrix .(a)Immunofluorescence staining for migration protein α – SMA treated with 20 µmol/L quercetin. (b, c) Under the intervention of different concentrations of quercetin, the protein levels of α-SMA in fibroblasts decreased in a concentration dependent manner. (d) Immunofluorescence staining for collagen I and collagen III. (e, f) The proteins levels of collagen I and III decreased in a concentration dependent manner treated with quercetin. . *Compared with the control group (p < 0.05).
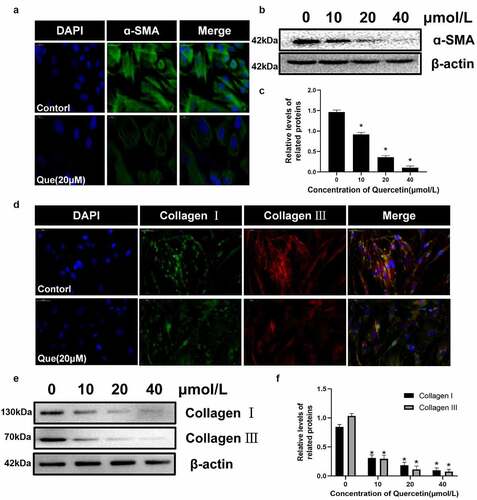
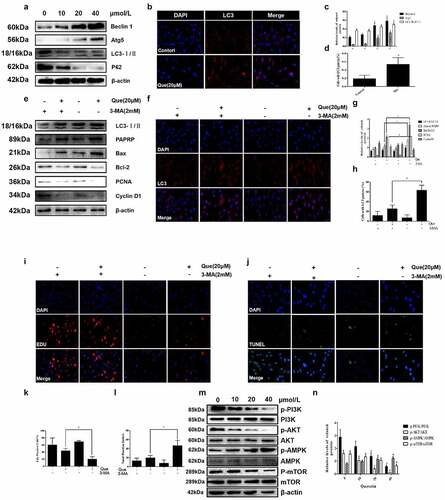
Figure 6. Quercetin regulates fibroblast apoptosis and proliferation through autophagy, and mTOR mediated signaling pathway is involved. (a, c)The expression levels of autophagy-related proteins Beclin-1, P62, LC3 and Atg5 in fibroblasts were analyzed by western blotting after cells were treated with various concentrations of quercetin for 24 h. (b, d) After 20 µmol/L quercetin treatment of fibroblasts for 24 h, immunofluorescence staining for flake LC3 fluorescent light. (e, f) After treated with Autophagy inhibitors 3-MA, the low expression levels of Cyclin D1 and PCNA were partly reversed, while the high expression levels of cleaved-PARP and LC3-II/LC3-I were partly inhibited. (g, h) Fibroblasts were exposed to 20 µmol/L quercetin or 2 mmol/L 3-MA, or a combined treatment of quercetin and 3-MA for 24 h. immunofluorescence staining for LC3 in fibroblasts . (i, j) Fibroblasts were exposed to 20 µmol/L quercetin or 2 mmol/L 3-MA, or a combined treatment of quercetin and 3-MA for 24 h. EdU staining showed that after treated with Autophagy inhibitors 3-MA, the proliferation limitation of fibroblasts induced by quercetin was reversed to a certain extent. (k, l) TUNEL staining for fibroblasts treated with 20 µmol/L quercetin and autophagy inhibitors 3-MA *p < 0.05 versus the control group. (m, n) The proteins levels of p-PI3K, p-AKT, p-MAPK and p-mTOR decreased in a concentration dependent manner treated with quercetin .β-actin was used as a control.