Figures & data
Table 1. Sequences for RT-qPCR.
Figure 1. Construction of tMCAO model. A. neurological deficit score; B. behavior test results; C. H&E staining; D. Nissl staining tested neuron loss; E. TUNEL staining tested neuronal apoptosis; F. TTC staining tested infarct area; G. serum levels of S100B, NSE, BDNF, SOD and MDA; H. hemoglobin content in mice; I. brain water content in mice. The data were all measurement data, in the form of mean ± standard deviation; * P < 0.05 vs. the sham group.
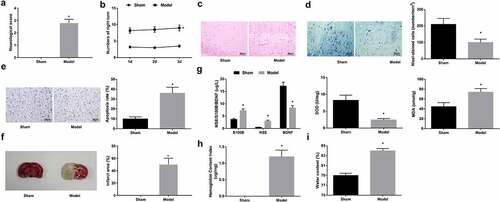
Figure 2. Down-regulating miR-489-3p inhibits neuronal apoptosis and improves neurological function of tMCAO mice. A. miR-489-3p expression in mice; B. miR-489-3p interference in mice; C. neurological deficit score; D. behavior test results; E. H&E staining; F. Nissl staining tested neuron loss; G. TUNEL staining tested neuronal apoptosis; H. TTC staining tested infarct area; I. serum levels of S100B, NSE, BDNF, SOD and MDA; J. hemoglobin content in mice; K. brain water content in mice. The data were all measurement data, in the form of mean ± standard deviation; * P < 0.05 vs. the antagomir NC group.
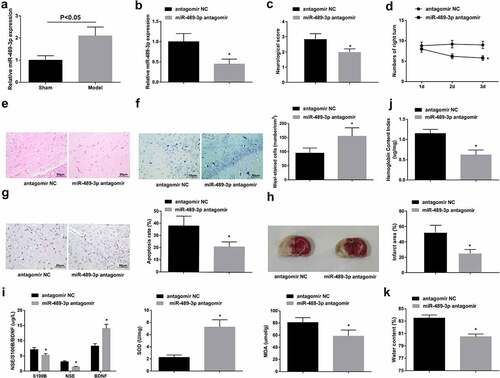
Figure 3. SIRT1 is targeted by miR-489-3p. A. SIRT1 expression in mice; B. The binding site of miR-489-3p and SIRT1; C. The luciferase activity; D. SIRT1 expression in mice. The data were all measurement data, in the form of mean ± standard deviation.
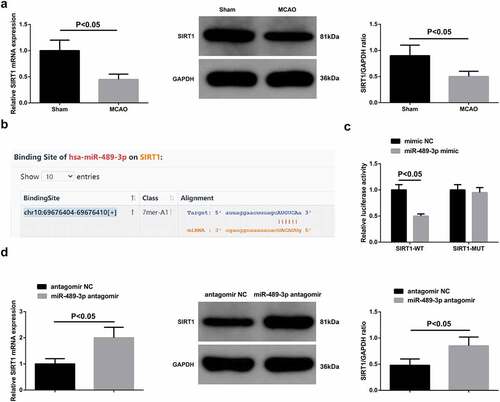
Figure 4. Restoring SIRT1 improves neurological function of tMCAO mice. A. SIRT1 expression in mice; B. neurological deficit score; C. behavior test results; D. H&E staining; E. Nissl staining tested neuron loss; F. TUNEL staining tested neuronal apoptosis; G. TTC staining tested infarct area; H. Serum levels of S100B, NSE, BDNF, SOD and MDA; I. hemoglobin content in mice; J. brain water content in mice. The data were all measurement data, in the form of mean ± standard deviation; * P < 0.05 vs. the oe-NC group.
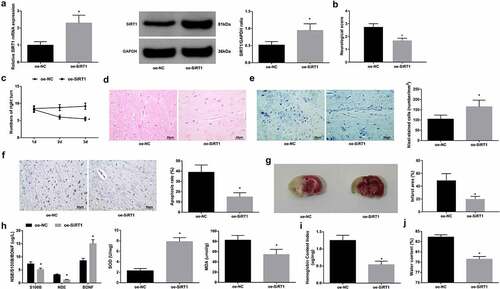
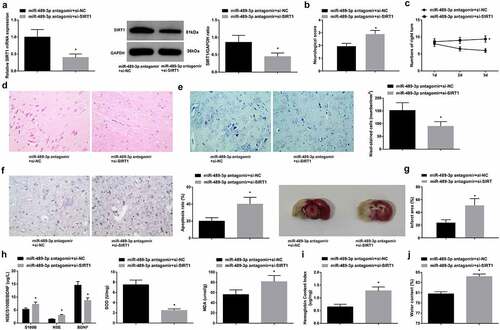
Figure 5. Inhibition of SIRT1 reduces the protective effect of depleted miR-489-3p on neurological function of tMCAO mice. A. SIRT1 expression in mice; B. neurological deficit score; C. behavior test results; D. H&E staining; E. Nissl staining tested neuron loss; F. TUNEL staining tested neuronal apoptosis; G. TTC staining tested infarct area; H. serum levels of S100B, NSE, BDNF, SOD and MDA; I. hemoglobin content in mice; J. brain water content in mice. The data were all measurement data, in the form of mean ± standard deviation; * P < 0.05 vs. the miR-489-3p antagomir + si-NC group.