Figures & data
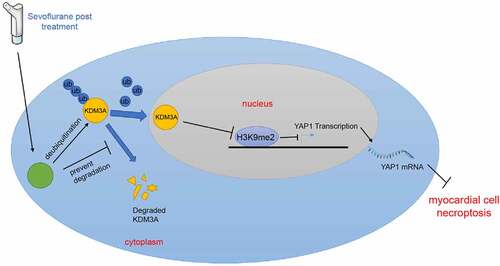
Table 1. Primer sequence of qRT-PCR
Figure 1. Sevo protects MI/RI rats and upregulates USP22 expression in the myocardium. MI/RI rat model was established and received SPC. A, LVEF% and LVFS% were tested by ultrasonic cardiogram, N = 18. B, pathological injury in rat myocardium was detected by H&E staining (black arrows indicate inflammatory cell infiltration), N = 6. C, rat myocardial infarction area was measured by TTC staining, N = 6. D, CK-MB, cTnI, and LDH levels in rat serum were evaluated, N = 18. E and F, USP22 expression in rat myocardium was determined by qRT-PCR (e) and western blot analysis (f), N = 6. The data were presented as mean ± standard deviation. One-way ANOVA was used to analyze the data in panels A-F. Tukey’s multiple comparisons test was applied for the post hoc test. * p < 0.05.
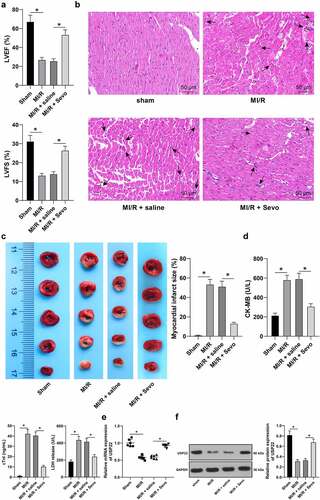
Figure 2. USP22 ablation reverses the protective effect of SPC on MI/RI rats. MI/RI rats subjected to SPC were injected with LV-sh-USP22, with sh-NC injection as control. A and B, USP22 expression in rat myocardium was determined by qRT-PCR (a) and western blot analysis (b), N = 6. C, LVEF% and LVFS% were tested by ultrasonic cardiogram, N = 18. D, pathological injury in rat myocardium was detected by H&E staining (black arrows indicate inflammatory cell infiltration), N = 6. E, rat myocardial infarction area was measured by TTC staining, N = 6. F, CK-MB, cTnI, and LDH levels in rat serum were evaluated, N = 18. The data were presented as mean ± standard deviation. One-way ANOVA was used to analyze the data in panels A-F. Tukey’s multiple comparisons test was applied for the post hoc test. * p < 0.05.
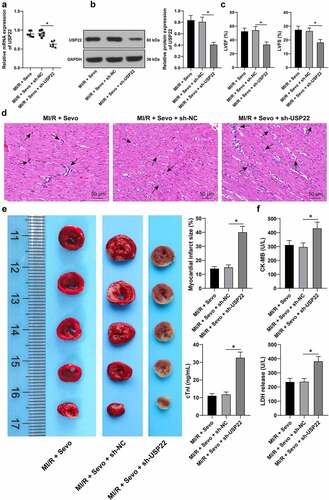
Figure 3. SPC protects H/R-treated H9c2 cells in vitro. H/R-treated H9c2 cells received SPC. A and B, USP22 expression in H9c2 cells was determined by qRT-PCR (a) and western blot analysis (b). C, H9c2 cell viability was tested by CCK-8 method. D, H9c2 cell apoptosis was detected by flow cytometry. E, cleaved-caspase-3 protein levels were detected by Western blot; F, CK-MB and cTnI levels in H9c2 cells were evaluated by ELISA. G, LDH level in H9c2 cells was evaluated by colorimetry. The independent experiments were conducted 3 times. The data were presented as mean ± standard deviation. One-way ANOVA was used to analyze the data in panels A, B, D-G, and two-way ANOVA was used to analyze the data in panel C. Tukey’s multiple comparisons test was applied for the post hoc test. * p < 0.05.
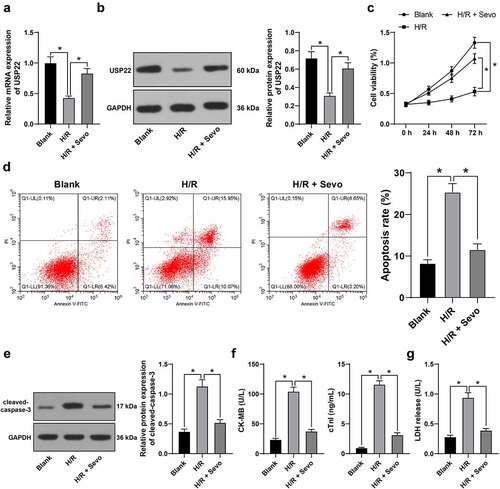
Figure 4. USP22 knockout reverses the protective effect of SPC on H/R-treated H9c2 cells. H9c2 cells were transfected with si-USP22-1 and si-USP22-2, with si-NC as control. A and B, USP22 expression in H9c2 cells was determined by qRT-PCR (a) and western blot analysis (b), followed by the combined experiment with SPC. C, H9c2 cell viability was tested by CCK-8 method. D, H9c2 cell apoptosis was detected by flow cytometry. E, cleaved-caspase-3 protein levels were detected by Western blot; F, CK-MB and cTnI levels in H9c2 cells were evaluated by ELISA. G, LDH level in H9c2 cells was evaluated by colorimetry. The independent experiments were conducted 3 times. The data were presented as mean ± standard deviation. One-way ANOVA was used to analyze the data in panels A, B, D-G, and two-way ANOVA was used to analyze the data in panel C. Tukey’s multiple comparisons test was applied for the post hoc test. * p < 0.05.
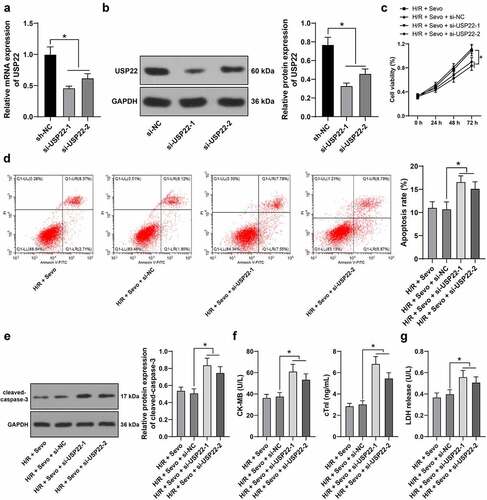
Figure 5. USP22 stabilizes KDM3A via deubiquitination, and KDM3A downregulates H3K9me2 level in the YAP1 promoter region to promote YAP1 transcription. A, the interaction between USP22 and KDM3A was detected by ChIP. B, KDM3A mRNA level in rat myocardium and H9c2 cells was measured by qRT-PCR (the first panel, N = 6). C, KDM3A and H3K9me2 protein levels in rat myocardium and H9c2 cells were evaluated by western blot analysis (the first and second panels, N = 6). D, ubiquitination level in rat myocardium and H9c2 cells was examined (the first panel, N = 6). E and F, KDM3A expression in H9c2 cells was detected by qRT-PCR (e) and western blot analysis (f). G, H3K9me2 enrichment in the YAP1 promoter region was verified by ChIP. H, YAP1 mRNA level in rat myocardium and H9c2 cells was determined by qRT-PCR (the first panel, N = 6). The independent experiments were conducted 3 times. The data were presented as mean ± standard deviation. One-way ANOVA was used to analyze the data in panels B, C, E, F, and H, and two-way ANOVA was used to analyze the data in panel G. Tukey’s multiple comparisons test was applied for the post hoc test. * p < 0.05.
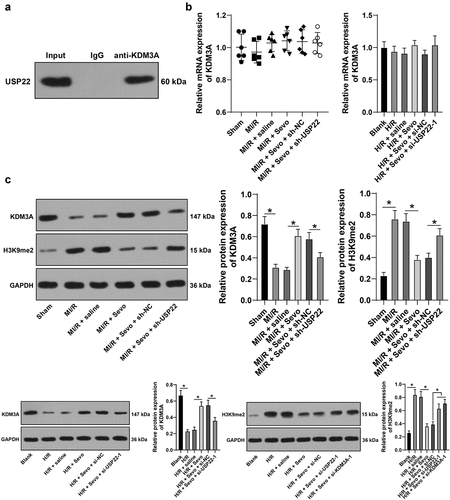
Figure 5. Continued.
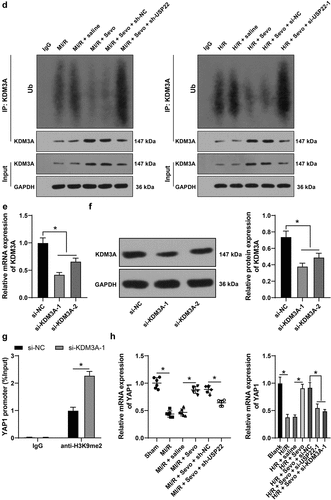
Figure 6. KDM3A silencing annuls the protective role of SPC in H/R-treated H9c2 cells. H/R-treated H9c2 cells with SPC were transfected with si-KDM3A. A, H9c2 cell viability was tested by CCK-8 method. B, H9c2 cell apoptosis was detected by flow cytometry. C, cleaved-caspase-3 protein levels were detected by Western blot; D, CK-MB and cTnI levels in H9c2 cells were evaluated by ELISA. E, LDH level in H9c2 cells was evaluated by colorimetry. The independent experiments were conducted 3 times. The data were presented as mean ± standard deviation. One-way ANOVA was used to analyze the data in panels B-E, and two-way ANOVA was used to analyze the data in panel A. Tukey’s multiple comparisons test was applied for the post hoc test. * p < 0.05.
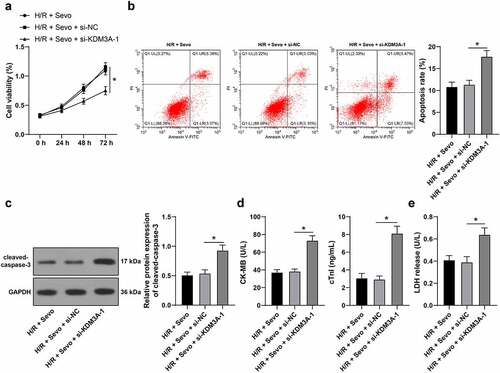
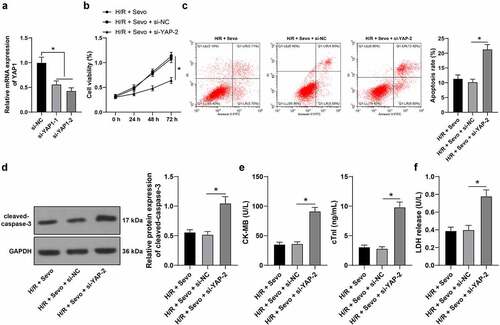
Figure 7. YAP1 silencing reverses the protective role of SPC in H/R-treated H9c2 cells. H9c2 cells were transfected si-YAP1-1 and si-YAP1-2, with si-NC as control. A, YAP1 mRNA level was measured by qRT-PCR, and si-YAP1-2 was selected to perform a combined experiment with SPC. B, H9c2 cell viability was tested by CCK-8 method. C, H9c2 cell apoptosis was detected by flow cytometry. D, cleaved-caspase-3 protein levels were detected by Western blot; E, CK-MB and cTnI levels in H9c2 cells were evaluated by ELISA. F, LDH level in H9c2 cells was evaluated by colorimetry. The independent experiments were conducted 3 times. The data were presented as mean ± standard deviation. One-way ANOVA was used to analyze the data in panels A and C-F, and two-way ANOVA was used to analyze the data in panel B. Tukey’s multiple comparisons test was applied for the post hoc test. * p < 0.05.