Figures & data
Table 1. Clinical data of both patients and controls.
Figure 1. Comparison of plasma levels of lncRNA ZNF503-AS1 between healthy participants and diabetic patients.
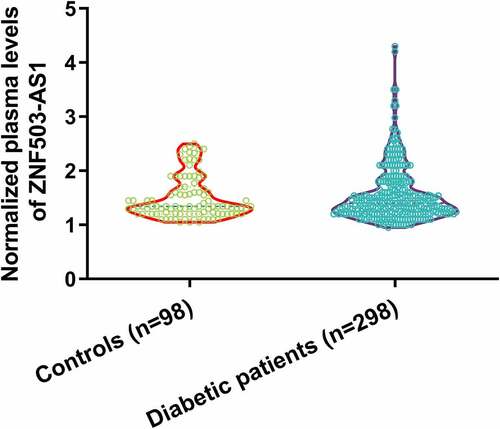
Figure 2. High plasma lncRNA ZNF503-AS1 levels were correlated with the incidence of diabetic retinopathy but not other diabetic complications. This figure shows the comparison of incidences of diabetic retinopathy (a), diabetic lung diseases (b), diabetic heart disease (c), and diabetic nephropathy (d) between high and low ZNF503-AS1 expression groups.
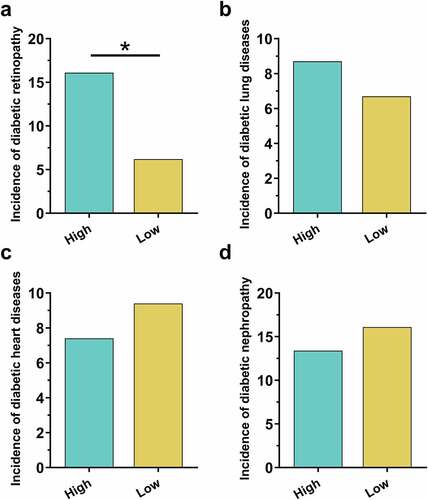
Figure 3. Comparison of plasma ZNF503-AS1 levels between patients with different diabetic complications. This figure shows the comparison of plasma ZNF503-AS1 levels between patients with different diabetic complications on the day of admission (a) and at the end of follow-up (b).
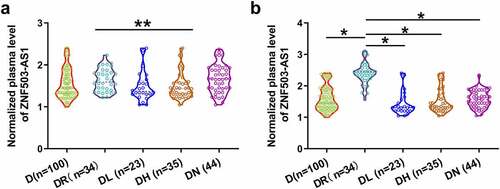
Figure 4. ZNF503-AS1 overexpression promoted TGF-β1 expression. This figure shows the effects of high glucose environments on ZNF503-AS1 expression in ARPE-19 cells (a). ZNF503-AS1 overexpression was achieved in human retinal pigment epithelial ARPE-19 cells (b), upregulation of TGF-β1 and TGF-β receptor1 (TGFBR1) protein after ZNF503-AS1 overexpression (d) and ZNF503-AS1 expression in ARPE-19 cells treated with exogenous TGF-β1 (d).
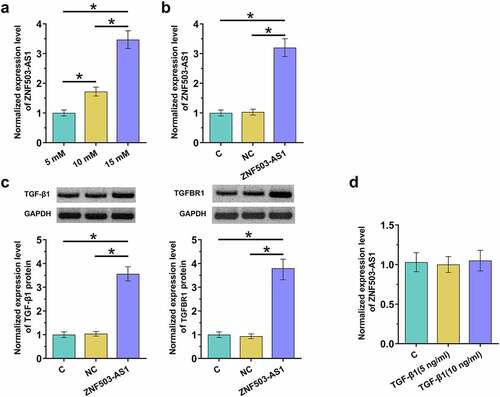
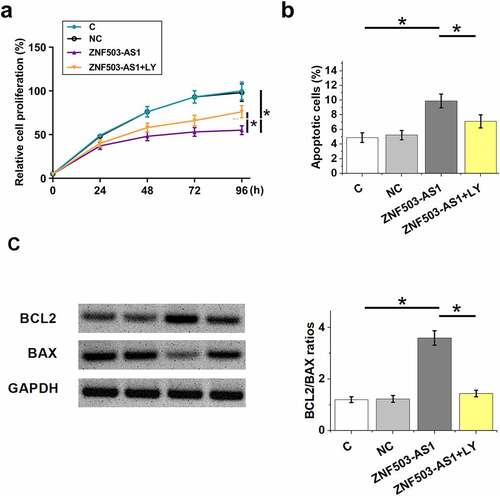
Figure 5. Effects of ZNF503-AS1 overexpression on ARPE-19 cell proliferation and apoptosis. This figure shows the proliferation (a) and apoptosis (b) of ARPE-19 cells after ZNF503-AS1 overexpression. BCL2 and BAX levels in transfection groups were determined using Western blot and Bcl2/Bax ratios were calculated (c).