Figures & data
Figure 1. Circ_0023984 shows high expression in ESCC tumor and cell lines.A, circ_0023984 is upregulated in ESCC in GSE131969 dataset; NC (normal tissues), ESCC (Esophageal Squamous Cell Carcinoma), data are expressed in Log2 FPKM. B, circ_0023984 level measured by RT-qPCR in ESCC tumor tissues (ESCC) and para-cancerous tissues (NC) from 70 ESCC patients; C, K-M survival analysis for assessing the overall survival in 70 patients; D. RT-qPCR analysis of circ_0023984 expression in ESCC cell lines (EC109, EC9706, KYSE30, KYSEE150, KYSE410) and normal esophageal epithelial cell line (SHEE); E, RT-qPCR analysis of NOX4 mRNA and circ_0023984 level after RNase R digestion. Statistics: A. E: students’ t test; B: Mann–Whitney U test; C: log-rank test; D: one-way analysis of variance (ANOVA) with Tukey’s post hoc test. * P < 0.05; **P < 0.01; ***P < 0.001.
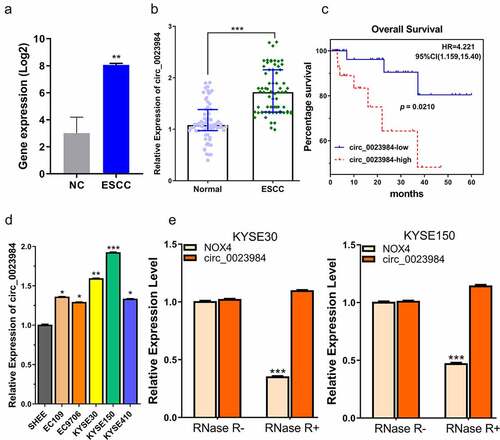
Figure 2. Knockdown of circ_0023984 suppresses ESCC cell growth, invasion and migration.A, RT-qPCR analysis of the knockdown efficiency of circ_0028934 shRNAs; B, CCK-8 proliferation assay in KYSE30 and KYSE150 cells after the knockdown of circ_0023984; C, EdU incorporation assay in KYSE30 and KYSE150 cells after the knockdown of circ_0023984; D, Colony formation assay in KYSE30 and KYSE150 cells after the knockdown of circ_0023984. E, Transwell migration assay in KYSE30 and KYSE150 cells after the knockdown of circ_0023984; F, Transwell invasion assay in KYSE30 and KYSE150 cells after the knockdown of circ_0023984. * P < 0.05; **P < 0.01; ***P < 0.001.
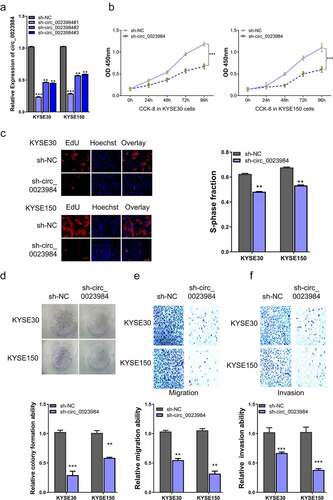
Figure 3. Circ_0023984 can target miR-134-5p.A, Subcellular fraction analysis to detect the cellular localization of circ_0023984 in KYSE150 and KYSE30 cells by RT-qPCR; B, circBank online tool predicts that circ_0023984 can target miR-134-5p; C, dual luciferase reporter assay in KYSE150 and KYSE30 cells using WT and MUT reporter, in the presence of miR-NC or miR-134-5p mimic; D, RNA pull-down assay using biotin-labeled circ_0023984 probe or control probe; E, RIP-qrt-PCR assay using anti-AGO2 antibody in KYSE30 and KYSE150 cells; F, RT-qPCR analysis of miR-134-5p level in KYSE30 and KYSE150 cells after circ_0023984 knockdown. * P < 0.05; **P < 0.01; ***P < 0.001.
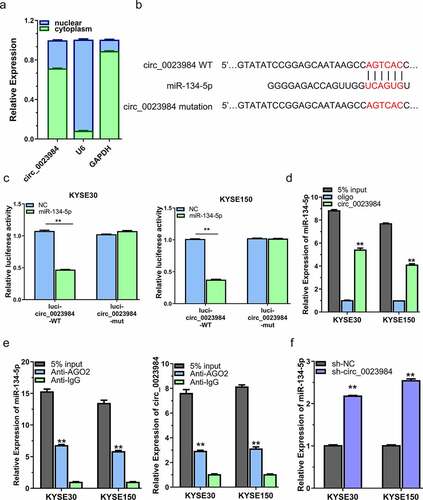
Figure 4. miR-134-5p negatively regulates CST4.A, CST4 showed high expression level in ESCC tissues (TCGA dataset with 162 ESCC samples and 11 normal samples); B, KM-plotter analysis of patients with high CST4 expression showed a poorer survival; C, Targetscan predicted that miR-134-5p targets the sequence of 2ʹURT in CST4 mRNA; D, dual luciferase reporter assay using WT and MUT reporter, in the presence of miR-NC or miR-134-5p mimic; E, WB analysis of CST4 protein level after miR-134-5p overexpressing in KYSE150 and KYSE30 cells; F, RT-qPCR analysis of miR-134-5p after the transfection with miR-134-5p inhibitor; G, WB analysis of CST4 level after the transfection with miR-134-5p inhibitor. * P < 0.05; **P < 0.01; ***P < 0.001.
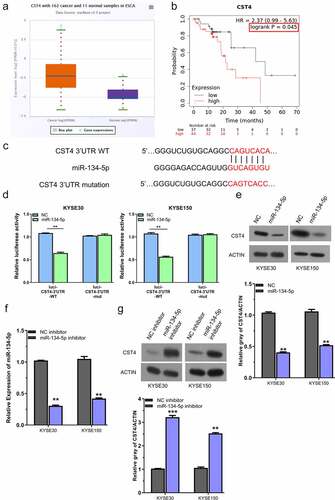
Figure 5. Circ_0023984 knockdown suppresses the malignant phenotype of ESCC by miR-134-5p/CST4 axis.A, WB analysis of CST4 protein levels in KYSE150 and KYSE30 cells with indicated treatments; B, CCK-8 proliferation assay at 0 h, 24 h, 48 h, and 72 h in different groups of KYSE30 and KYSE150 cells; C, EdU incorporation assay in different groups of KYSE150 and KYSE30 cells; D, Clonogenic assay in different groups of KYSE150 and KYSE30 cells; E, Transwell migration assay in different groups of KYSE150 and KYSE30 cells; F, Transwell invasion assay in different groups of KYSE30 and KYSE150 cells. * P < 0.05; **P < 0.01; ***P < 0.001.
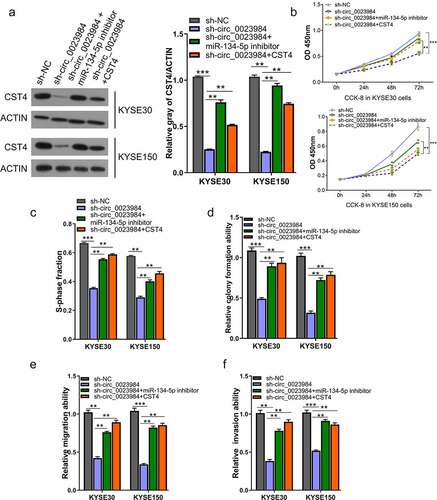
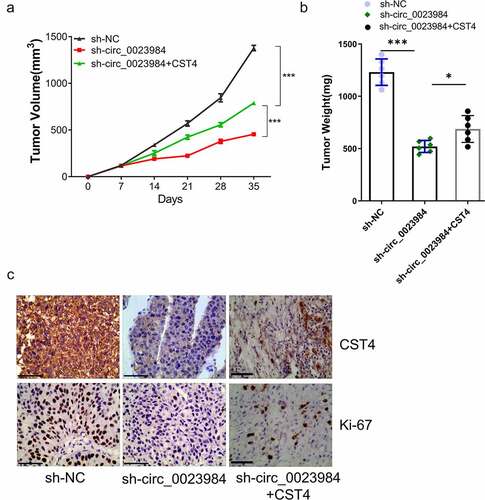
Figure 6. CST4 regulates effect of circ_0023984 on the in vivo tumorigenesis.The nude mice were subcutaneously injected with KYSE150 cells expressing sh-NC, sh-circ_0023984, sh-circ_0023984 and CST4 (n = 6 in each group). A, Subcutaneous xenograft volume in each group was measured; B, subcutaneous tumor weight of in each group was measured at the end of the experiment; C, immunohistochemistry (IHC) was performed to detect the expression of Ki-67 and CST4 in tumor sections of different groups. * P < 0.05; **P < 0.01; ***P < 0.001.