Figures & data
Figure 1. SNHG10 is downregulated in triple-negative breast cancer and is further downregulated by doxorubicin treatment. The expression levels of SNHG10 in triple-negative breast cancer (TNBC) tissues and adjacent non-tumor tissues before treatment were measured by RT-qPCR. The expression levels of SNHG10 in TNBC tissues were also measured by RT-qPCR after doxorubicin treatment. All reactions were performed in triplicate, and a paired t test was used to compare the mean values between the two tissue types and two time points. *, p < 0.05; ***, p < 0.001.
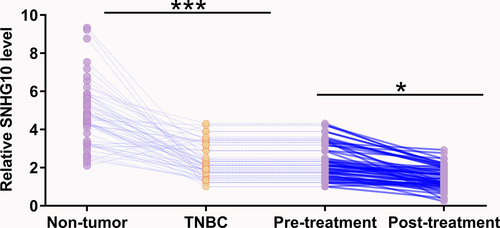
Figure 2. MiR-302b is downregulated in TNBC and is positively correlated with SNHG10. The expression levels of miR-302b in both TNBC and adjacent non-tumor tissues were measured by RT-qPCR. All reactions were performed in triplicate, and a paired t test was used to compare the mean values between the two types of tissues (a). ***, p < 0.001. Correlations between the expression levels of SNHG10 and miR-302b in TNBC tissues (b) and non-tumor tissues (c) were analyzed by linear regression.
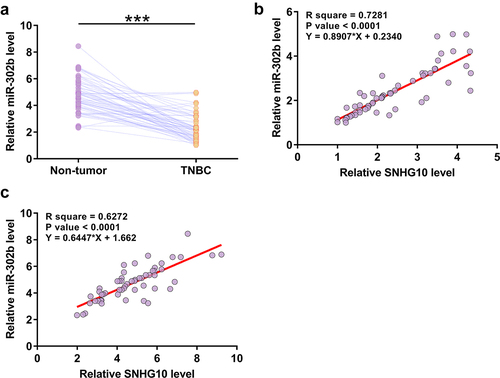
Figure 3. SNHG10 upregulates miR-302b levels through methylation. BT-549 and MDA-MB-157 cells were transfected with either a miR-302b mimic or SNHG10 expression vector, and overexpression was confirmed by RT-qPCR 48 h later (a). The effects of miR-302b overexpression on the expression of SNHG10 (b) and the effects of SNHG10 overexpression on miR-302b (c) were also analyzed by RT-qPCR. Methylation-specific PCR analysis of the miR-302b gene. U refers to the U6 control, and M refers to miR-302b. (d). *, p < 0.05.
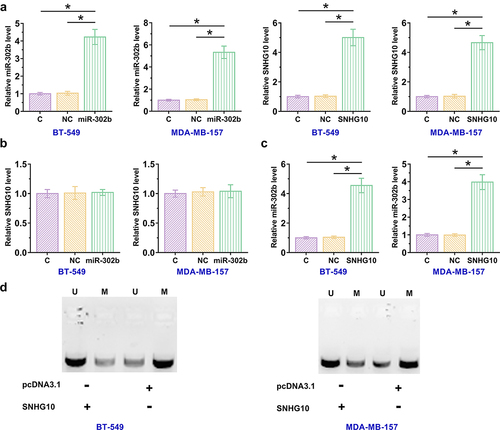
Figure 4. SNHG10 and miR-302b promote doxorubicin-induced TNBC cell apoptosis. BT-549 and MDA-MB-157 cells were treated with doxorubicin at doses of 0, 1, 5 and 10 ng/ml for 48 h, and then the expression levels of SNHG10 were measured using RT-qPCR (a). A cell apoptosis assay was performed to analyze the effects of overexpression of SNHG10 and miR-20b on the apoptosis of BT-549 and MDA-MB-157 cells (b). *, p < 0.05.
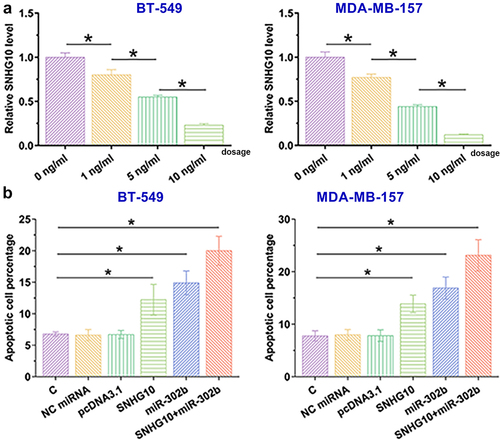
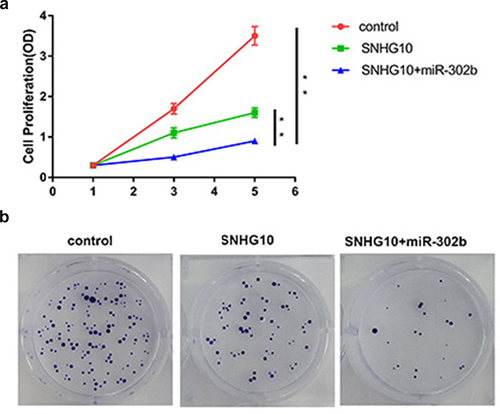
Figure 5. SNHG10 and miR-302b regulates the proliferation and colony formation of BT-549 cell apoptosis. The proliferation (a) and colony formation of BC cells transfected with SNHG10 or co-transfected with SNHG10 and a miR-302b mimic was evaluated using the CCK-8 assay and colony formation assay, respectively. Colony formation assay (b) was used to evaluate the proliferation of TNBC cells transfected with SNHG10 or co-transfected with SNHG10 and a miR-320b mimic. **, p < 0.01.