Figures & data
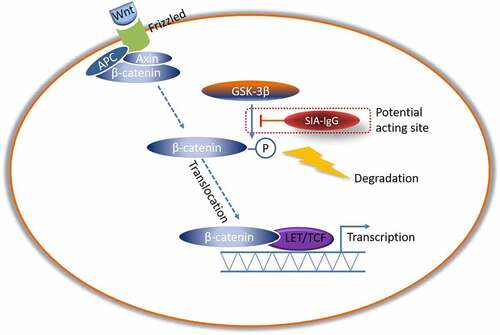
Figure 1. The expression of SIA-IgG is correlated with clinical prognosis in breast cancer. Immunohistochemistry staining for SIA-IgG in breast cancer tissues. For example, infiltrating ductal carcinoma showed weak SIA-IgG-positive staining in the tissues of surviving patients (a, b, and c) and strong SIA-IgG-positive staining in the tissues of deceased patients (d, e, f, and g) with invasive breast cancer. The clinical characteristics of the tissues are as follows: (a) well differentiated (grade I), without lymph node metastasis, TNM stage IIA. (b) moderately differentiated (grade I), without lymph node metastasis, TNM stage IIB. (c) moderately differentiated (grade II), with lymph node metastasis (TNM-N1), TNM stage IIIA. (d) moderately differentiated (grade II), with lymph node metastasis (TNM-N2), TNM stage IIA. (e) moderately differentiated (grade II), without lymph node metastasis, TNM stage IIB. (f) moderately differentiated (grade II), with lymph node metastasis (TNM-N1), TNM stage IIIA. (g) moderately differentiated (grade II), with lymph node metastasis (TNM-N1), TNM stage IIIB. (h) Kaplan–Meier survival for SIA-IgG high expression and low expression groups. Patients in the SIA-IgG high expression group (SIA-IgGhigh, staining score ≥ 150) had a significantly poorer prognosis than those in the SIA-IgG low expression (SIA-IgGlow, staining score < 150) group (P = 0.01).
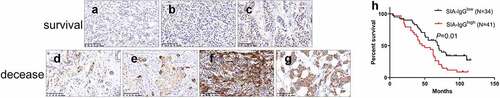
Table 1. Association between SIA-IgG expression and clinicopatholioical characteristics.
Table 2. Cox proportional hazards model analysis of prognostic factors in patients with breast cancer.
Figure 2. Anti-SIA-IgG treatment effectively suppressed cell growth in MDA-MB-231, MCF-7 and MCF-10A cells. (a) and (b), proliferation of SIA-IgG-treated MDA-MB-231, MCF-7 and MCF-10A cells were detected by clone formation assay and CCK-8 assay. (c) an apoptosis assay based on AV/PI flow cytometry was performed after the cells were treated with RP215 antibody, control antibody (mouse IgG) and saline for 48 h. Data are expressed as the means ± SEM. */#/a P < 0.05, **/##/aa P < 0.01, ***/###/aaa P < 0.001, and ns P > 0.05.
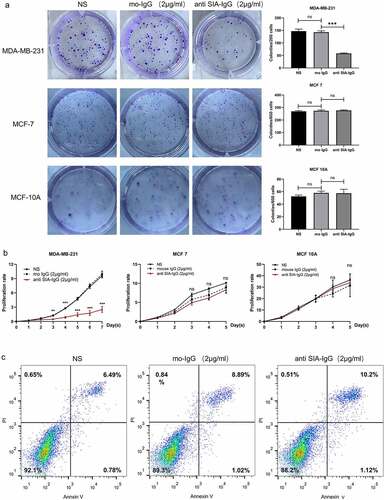
Figure 3. Anti-SIA-IgG treatment effectively suppressed metastasis and invasion in MDA-MB-231 cells. (a) the migration ability of MDA-MB-231 cells was analyzed by wound healing. Images were taken at 0, 24, and 48 h after antibody treatment. (b) and (c) the migration ability of MDA-MB-231, MCF-7 and MCF-10A cells were analyzed by Transwell assay. Images of MDA-MB-231 and MCF-10A cells were taken at 24 h and 48 h. Images of MCF-7 cells were taken at 48 h and 72 h. Invasion capacity of MDA-MB-231 were analyzed by and Transwell inserts coated with Matrigel matrix. Images were taken at 24 h and 48 h. The final concentrations of RP215 and control antibody used in the clone formation assay, apoptosis assay, wound healing assay, Transwell migration and invasion assays were 2 μg/ml. Data are expressed as the means ± SEM. * P < 0.05, ** P < 0.01, *** P < 0.001 and ns P > 0.05.
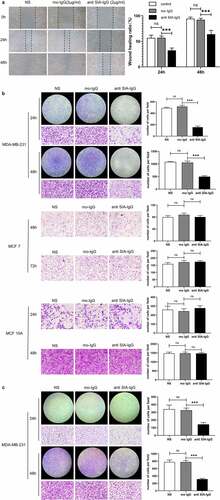
Figure 4. Addition of SIA-IgG to MDA-MB-231 cells is able to rescue proliferation and migration. (a–b), Functional rescue experiments were carried out in MDA-MB-231 cells including CCK-8 assay (Figure 4a) and transwell metastasis assay (Figure 4b). Data are expressed as the means ± SEM. * P < 0.05, ** P < 0.01, *** P < 0.001 and ns P > 0.05.
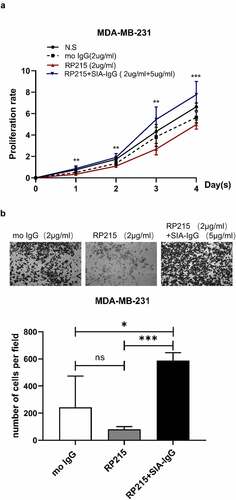
Figure 5. Anti-SIA-IgG treatment effectively suppressed breast cancer cell growth in vivo. (a–e), xenograft model in nude mice. Eight-week-old female nude mice were subcutaneously injected with 2 × 10⁶ MDA-MB-231 cells, tumor nodules were harvested at Day 30 ()), and tumor weights were measured (). During this period, peritumoral injection of monoclonal antibody RP215 and control antibody (mouse IgG) was performed separately at 5 µg per tumor twice. The length and width of tumors were measured every 3 days after the first subcutaneous injection, and tumor volume was calculated according to the formula 0.52 × length × width2 (). Tumor tissues from nude mice were then used for hematoxylin-eosin (HE) staining. In addition, we performed IHC staining to analyze SIA-IgG expression in tumor tissues from nude mice (). (f–h) three groups of 8-week-old female nude mice were subcutaneously injected with 2 × 10⁶ MDA-MB-231 cells transfected with 2 siRNAs against IgG and control siRNA separately (group siRNA1, group siRNA2, group NC). The animals were sacrificed at Day 32, and the tumors were harvested ()) and weighed (). Each Data are expressed as means ± SEM. * P < 0.05.
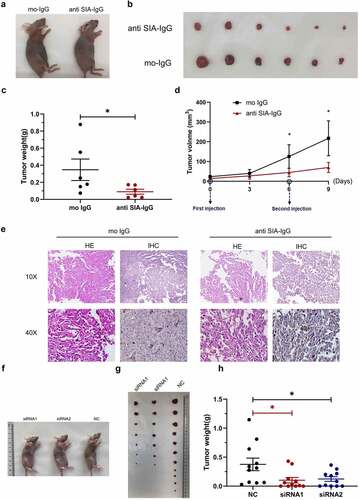
Figure 6. SIA-IgG may regulate biological features of breast cancer cells through Wnt/β-catenin pathway via mediate GSK3β. Detection of Wnt/β-catenin pathway related proteins by western blotting analysis in protein extracted from MDA-MB-231 cells which knocked IgG by siRNAs.