Figures & data
Table 1. Clinicopathologic characteristics of study subjects
Figure 1. Circ_0001823 was over-expressed in CC tissues as well as cells.A Volcano map showed significant differentially expressed circRNAs via log2-fold change and log10 p-values. The circ_0001823 expression in the CC patients (b) and CC cells (c) were measured by qRT-PCR asssay. D-E Verification of circ_0001823 stability. *P < 0.05. **P < 0.01.
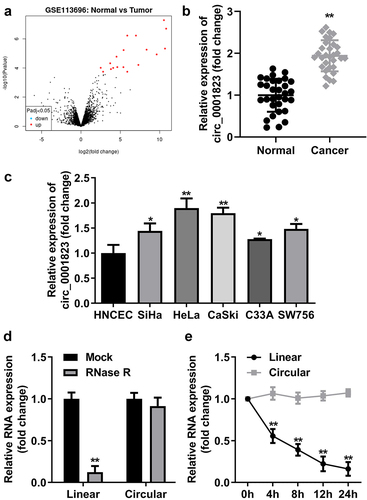
Figure 2. Circ_0001823 knockdown inhibited the proliferation of the CC cells. A Validation of sh-circ_0001823 transfection efficiency. B-C After sh-circ_0001823 transfection, CCK-8 and colony formation assays were performed to measure the cell viability and cloned cells numbers. **P < 0.01.
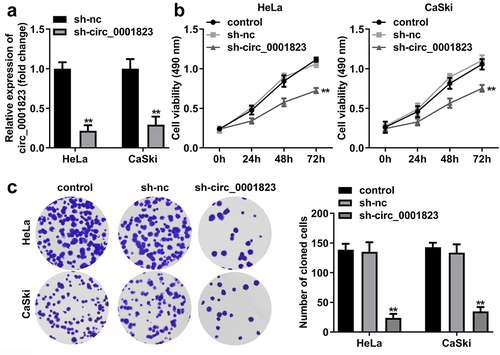
Figure 3. Circ_0001823-silenced inhibited the malignant behavior of the CC cells. A-B After sh-circ_0001823 transfection, transwell assay was conducted to analyze the migration and invasion of the CC cells . **P < 0.01.
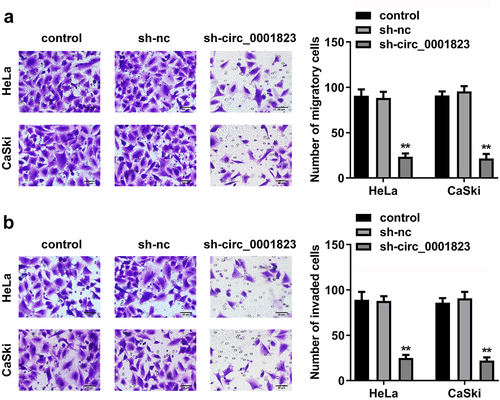
Figure 4. Circ_0001823 overexpression promoted the proliferation of the CC cells. A Validation of oe-circ_0001823 transfection efficiency. B-C After oe-circ_0001823 transfection, CCK-8 and colony formation assays were performed to measure the cell viability and cloned cells numbers. *P < 0.05. **P < 0.01.
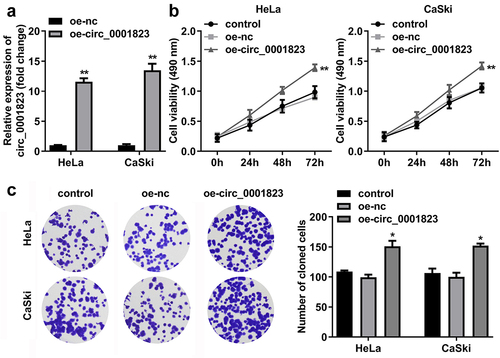
Figure 5. Circ_0001823-overexpressed promoted the malignant behavior of the CC cells. A-B After oe-circ_0001823 transfection, transwell assay was conducted to analyze the migration and invasion of the CC cells . *P < 0.05.
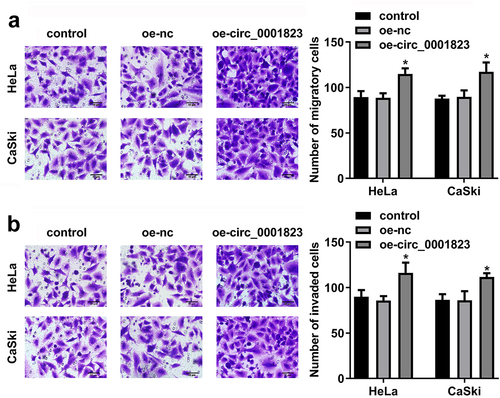
Figure 6. Circ_0001823 acted as a miR-613 sponge in CC cells. A The predicted circ_0001823 binding site in the miR-613 3’-UTR. B-C Double Luciferase Report and RNA pull-down assays were carried out to confirmed circ_0001823 could bind to miR-613. D The miR-613 expression in the CC cells was measured with qRT-PCR assay after sh-circ_0001823 transfection. E-F The miR-613 expression in the CC tissues as well as cells was detected with qRT-PCR assay. **P < 0.01.
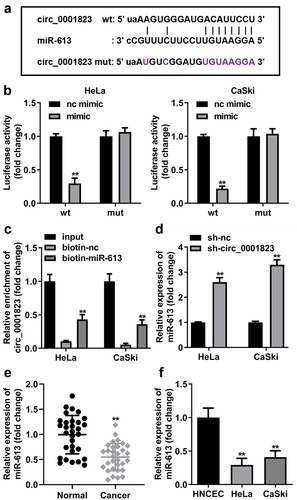
Figure 7. miR-613 inhibitor treatment reversed the effects of sh-circ_0001823 on the cell viability as well as cloned cells numbers in the CC cells.A Validation of miR-613 inhibitor or mimic transfection efficiency. B-C After sh-circ_0001823 and miR-613 inhibitor transfection, the cell viability and cloned cells numbers were measured by CCK-8 and colony formation assays. **P < 0.01 VS control group. #P < 0.05, ##P < 0.01 VS sh-circ_0001823+ miR-613 inhibitor nc group.
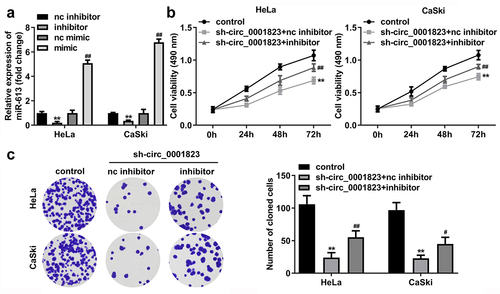
Figure 8. miR-613 inhibitor treatment inverted the effects of sh-circ_0001823 on the metastasis of the CC cells. A-B After sh-circ_0001823 as well as miR-613 inhibitor transfection, transwell assay was performed to detect the migration and invasion of the CC cells. **P < 0.01 VS control group. ##P < 0.01 VS sh-circ_0001823+ miR-613 inhibitor nc group.
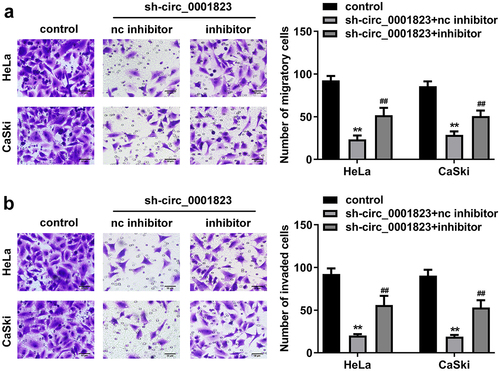
Figure 9. RAB8A targeted to miR-613 in CC cells. A The predicted RAB8A binding site in the miR-613 3’-UTR. B the 3D structure of RAB8A protein. C-D Double Luciferase Report and RNA pull-down assays were carried out to confirmed RAB8A could bind to miR-613. E The RAB8A expression in the CC cells was measured with qRT-PCR assay after sh-circ_0001823 and miR-613 inhibitor transfection. F-G The RAB8A expression in the CC tissues as well as cells was detected with qRT-PCR assay.
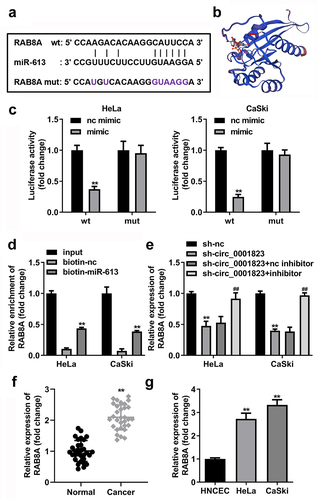
Figure 10. RAB8A-silenced inhibited the malignant behavior of the CC cells. A Validation of sh-RAB8A transfection efficiency. B-C After sh-RAB8A transfection, CCK-8 and colony formation assays were performed to measure the cell viability and cloned cells numbers. D-E After sh-RAB8A transfection, transwell assay was conducted to analyze the migration and invasion of the CC cells . **P < 0.01.
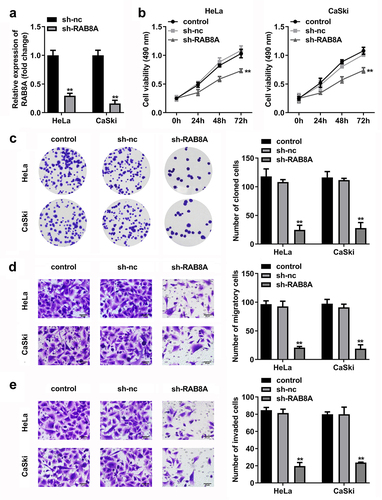
Figure 11. Over-expressed RAB8A inverted the effects of miR-613 mimic on the cell viability and cloned cells numbers of the CC cells. A Validation of RAB8A transfection efficiency. B-C After RAB8A and miR-613 mimic transfection, the cell viability and cloned cells numbers were measured by CCK-8 and colony formation assays. **P < 0.01 VS control group. #P < 0.05, ##P < 0.01 VS miR-613 mimic+vector group.
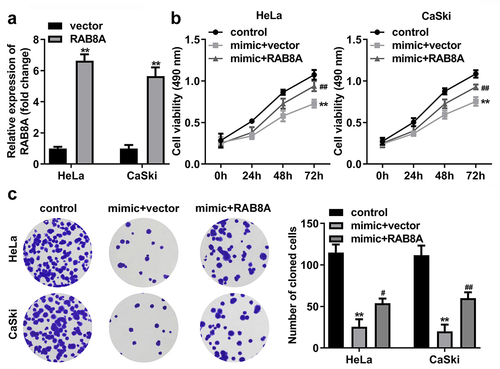
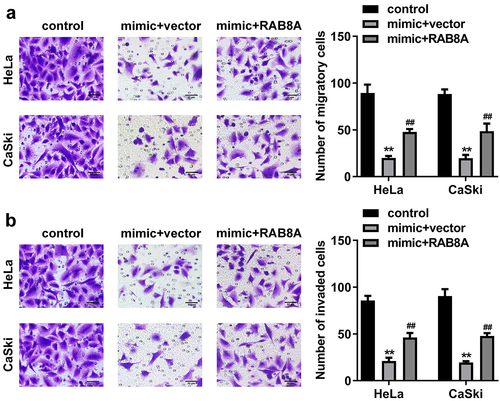
Figure 12. Over-expressed RAB8A inverted the effects of miR-613 mimic on the metastasis of the CC cells. A-B After RAB8A and miR-613 mimic transfection, the migration and invasion of the CC cells were determined with transwell assay. **P < 0.01 VS control group. ##P < 0.01 VS miR-613 mimic+vector group.