
Figures & data
Table 1. Primer sequences
Figure 1. RAD001 promoted autophagy by blocking the RT-induced PI3K/AKT/mTOR pathway in CC cells. (a) The radiosensitivity of CaSki and Hela cells was assessed using colony formation assay; (b) The expression levels of PI3K/AKT/mTOR pathway-related proteins were detected by WB; (c) Autophagy-related proteins LC3-II, LC3-I, and p62 expression levels were measured by WB; (d) Acidic autophagic vesicles in CC cells were detected by the fluorescence microscope and flow cytometry, indicating the formation of acidic vesicular organelle 24 hours after RT, and the values were normalized to that in the blank group. The radiation dose was 6 Gy, and the cell experiment was conducted 3 times. Data were expressed as mean ± SD, the independent sample t-test was used for comparisons between the two groups, and one-way ANOVA was used for comparisons among multiple groups. Tukey’s multiple comparisons test was adopted for the post hoc analysis. ***P < 0.001, **P < 0.01.
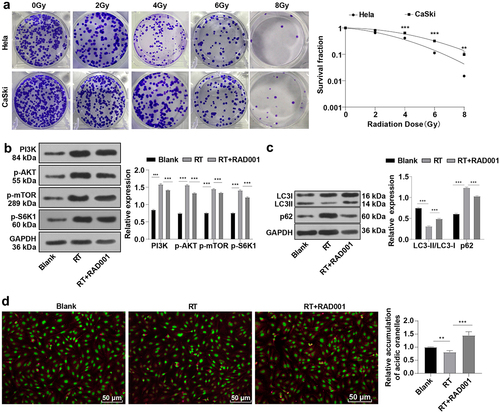
Figure 2. RAD001 promoted the RT-induced CC cell apoptosis, inhibited migration and invasion. (a) CC cell apoptosis rate was detected by flow cytometry; (b) CC cell migration and invasion abilities were assessed using Transwell assays. The radiation dose was 6 Gy, and the cell experiment was conducted 3 times. Data were presented as mean ± SD. One-way ANOVA was used for data comparisons between multiple groups and Tukey’s multiple comparisons test was adopted for the post hoc analysis.**P < 0.01, *P < 0.05.
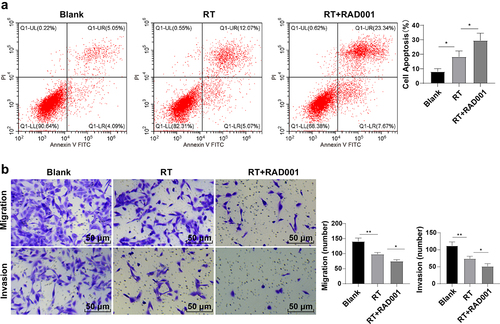
Figure 3. RAD001 increased radiosensitivity of CC cells. Colony formation assay was employed to determine the radiosensitivity of CC cells. The cell experiment was conducted 3 times. Data were exhibited as mean ± SD and independent sample t-test was implemented for data comparisons between the two groups. ***P < 0.001, *P < 0.05.
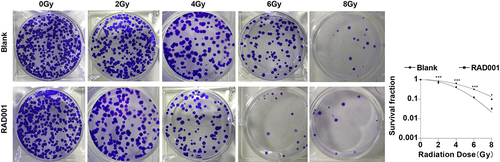
Figure 4. RAD001 augmented RT-induced PD-L1 expression in CC cells. (a) PD-L1 expression in CC cells was detected using flow cytometry; (b) PD-L1 level in CC cells was measured by RT-qPCR. The radiation dose was 6 Gy, and the cell experiment was conducted 3 times. Data were displayed as mean ± SD. One-way ANOVA was employed for data comparisons between multiple groups and Tukey’s multiple comparisons test was used for the post hoc analysis. **P < 0.01.
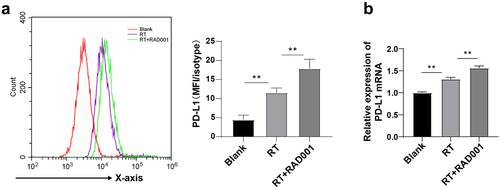
Figure 5. RAD001 combined with PD-1 blockade increased radiosensitivity of CC mice. (a-b) Tumor weight and volume of CC mice were recorded; (c) The expression of Ki67-positive cells was determined by immunohistochemical staining; (d) mTOR signaling pathway-related proteins were detected by WB. The radiation dose was 6 Gy, N = 8. Data were expressed as mean ± SD. One-way ANOVA was performed for data comparisons between multiple groups and Tukey’s multiple comparisons test was employed for the post hoc analysis. ***P < 0.001, **P < 0.01, *P < 0.05.
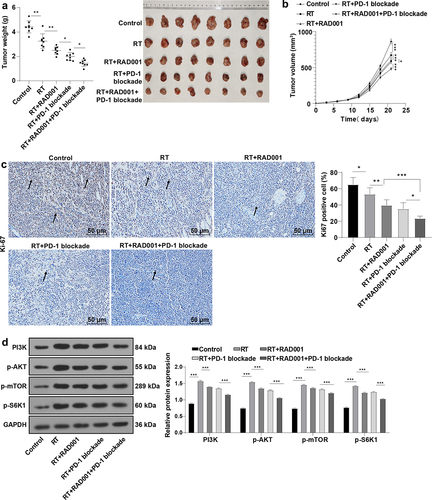
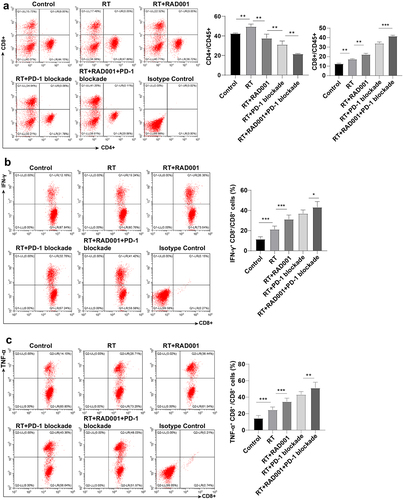
Figure 6. RAD001 combined with PD-1 blockade enhanced RT-induced CD8 + T cell number and killing ability in CC mice. (a) The number of CD8 + T and CD4 + T cells was measured by flow cytometry; (b) The ability of CD8 + T cells to produce IFN-γ was assessed using flow cytometry; (c) The ability of CD8 + T cells to produce TNF-α was evaluated via flow cytometry. The radiation dose was 6 Gy, N = 8. Data were presented as mean ± SD. One-way ANOVA was adopted for data comparisons among multiple groups and Tukey’s multiple comparisons test was implemented for the post hoc analysis. **P < 0.01, *P < 0.05.
Data availability statement
All the data generated or analyzed during this study are included in this published article.