Figures & data
Table 1. qPCR primer list
Figure 1. Expression levels of H19, MAP1LC3A (LC3) and Beclin-1 (BECN1) in GBM and the association among them. (a) H19 expression in GBM and normal tissues was detected via qPCR; (b, c) The expression of MAP1LC3A and BECN1 in GBM and normal tissues was measured via qPCR; (d) Correlation analysis of H19 and MAP1LC3A; (e) Correlation analysis of H19 and BECN1. ***P < 0.001, compared with normal tissues.
Figure 2. Effects of H19 knockdown on the viability, proliferation and apoptosis of GBM cells. (a) qPCR analysis for analyzing the efficiency of H19 knockdown; (b) CCK-8 assay for analyzing cell viability in the sh-H19 and sh-NC groups; (c) Colony formation assay for analyzing cell proliferation in the sh-H19 and sh-NC groups; (d) Flow cytometry for analyzing cell apoptosis in the sh-H19 and sh-NC groups. *P< 0.05, **P < 0.01, ***P < 0.001, compared with the sh-NC group.
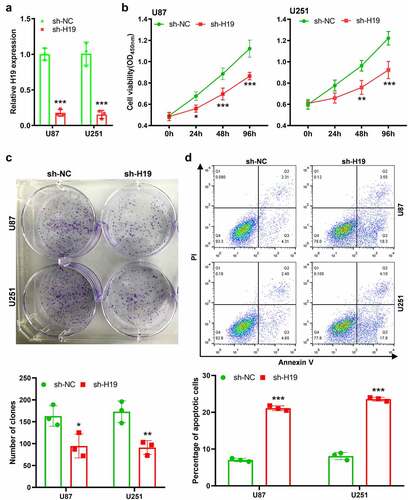
Figure 3. Inhibitory effects of H19 knockdown on the growth and autophagy of GBM cells were reversed by rapamycin. (a) CCK-8 and colony formation assays for detecting the proliferation ability of GBM cells in the sh-NC, sh-H19 and sh-H19+ rapamycin groups; (b) Colony formation assay for detecting the proliferation of GBM cells in each group; (c) Flow cytometry for detecting apoptosis in the sh-NC, sh-H19 and sh-H19+ rapamycin groups; (d) Western blotting for analyzing the expression of Beclin-1, p62, LC3-I and LC3-II in GBM cells in the sh-NC, sh-H19 and sh-H19+ rapamycin groups. (e) GFP-LC3 fluorescence analysis for detecting the LC3 positive structure and autophagy activity in the sh-NC, sh-H19 and sh-H19+ rapamycin groups. **P < 0.01, ***P < 0.001, compared with the sh-NC group; ##P < 0.01, ###P < 0.001, compared with the sh-H19 group; scale bar = 5 μm.
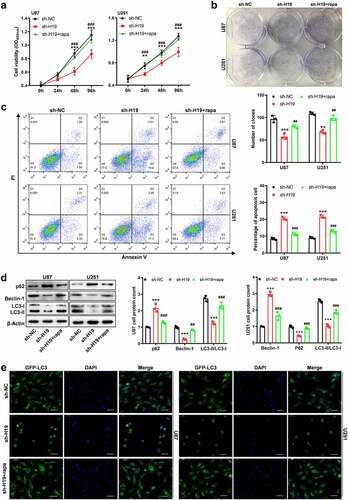
Figure 4. Prediction and validation of the interaction between H19 and miR-491-5p. (a) The binding sites of miR-491-5p and H19 were predicted using the ENCORI database; (b) RNA pull-down assay using a biotin-labeled H19 probe was performed, and miR-491-5p expression was measured via qPCR to analyze the direct interaction between H19 and miR-491-5p; anti-H19: antisense of the H19 probe (negative control), H19: H19 probe; (c) Validation of the binding between H19 and miR491-5p in U87 cells was performed via dual-luciferase reporter assay; (d) qPCR analysis was performed to analyze miR-491-5p expression in GBM and normal tissues; (e) Correlation analysis of miR-491-5p and H19 in GBM and normal tissues; (f) qPCR was performed to detect the level of miR-491-5p in response to H19 knockdown in U87 and U251 cells. **P < 0.01, ***P < 0.001, compared with mimic-NC, normal tissues or sh-NC.
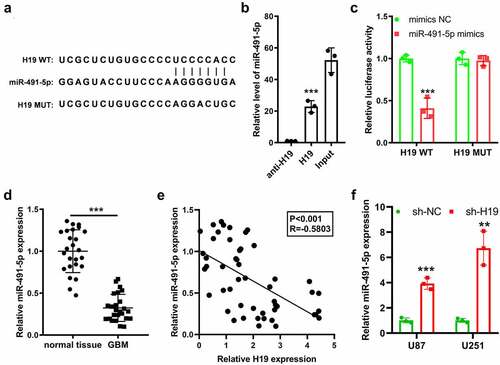
Figure 5. miR-491-5p overexpression disturbed the inhibitory effects of sh-H19 on the malignancy and autophagy of GBM cells in vitro. (a) qPCR was performed to detect the level of miR-491-5p in response to sh-H19 and miR-491 antagomir in U87 and U251 cells; (b) CCK-8 assay was performed to analyze the effects of sh-H19 and miR-491 antagomir on the viability of U87 and U251; (c) Colony formation assay was performed to analyze the effects of sh-H19 and miR-491 antagomir on the proliferation of U87 and U251 cells; (d) Flow cytometry was performed to analyze the apoptotic rate of cells in each group; (e) Western blotting was performed to analyze the expression of Beclin-1, p62, LC3-I and LC3-II in U87 and U251 cells. **P < 0.01, ***P < 0.001, compared with the sh-NC group; ##P < 0.01, ###P < 0.001, compared with the sh-H19 group; antamiR: miR-491-5p antagomir.
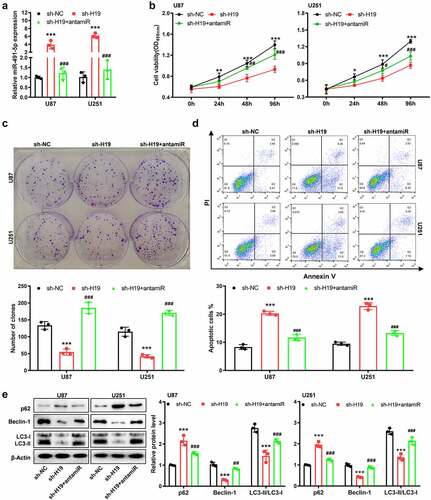
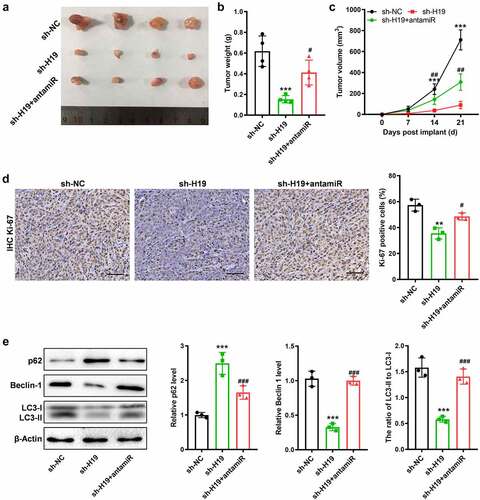
Figure 6. Suppressed miR-491-5p antagonized the anti-tumor and anti-autophagy effects of sh-H19 in vivo. (a) Tumor xenograft size in each group; (b, c) Quantitative analysis of the volume and weight of the tumor xenograft; (d) IHC analysis of Ki-67 in the GBM tissues generated with cells with various treatments; (e) Western blotting for analyzing the expression of Beclin-1, p62, LC3-I and LC3-II in the three groups of xenografts. **P < 0.01, ***P < 0.001, compared with the sh-NC group; #P < 0.05, ##P < 0.01, ###P < 0.001, compared with the sh-H19 group.