
Figures & data
Figure 1. miR-4733-5p is upregulated in GBC. (a) Volcano plot of miRNA expression array from GSE104165 dataset. (b) The five differentially expressed miRNAs in GBC from GSE104165 dataset. (c) CCK-8 assays of NOZ and GBC-SD cells transiently transfected with five miRNA mimic and negative control mimic (NC-mimic). (d) Validation of miR-4733-5p expression in 28 pairs of GBC and adjacent normal tissues. (e) Representative ISH images of miR-4733-5p stained in 28 pairs of GBC and adjacent normal tissues by anti-miR-4733-5p probe, scare bar = 100 μm (left) and 50 μm (right). Unpaired Student’ s t test was used in b, c and d (*p <0.05, **p <0.01, ***p <0.001).
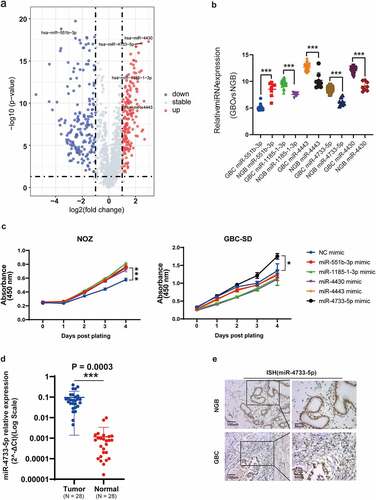
Figure 2. miR-4733-5p promotes GBC cell proliferation and colony formation in vitro. (a, b) The efficiency of miR-4733-5p overexpression (a) or knockdown (b) in both NOZ and GBC-SD cells transfected with miR-4733-5p mimic or miR-4733-5p inhibitor. (c, d) CCK-8 assay of NOZ and GBC-SD cells transfected with miR-4733-5p mimic or inhibitor and the corresponding NC mimic or anti-NC. (e) Colony formation assay of NOZ and GBC-SD cells transfected with the miR-4733-5p mimic or inhibitor and the corresponding NC mimic or anti-NC, representative images of colony formation assay (left), the number of colonies in each group was counted in the diagrams (right). Unpaired Student’ s t test was used in a, b, c and d (*p <0.05, **p <0.01, ***p <0.001).
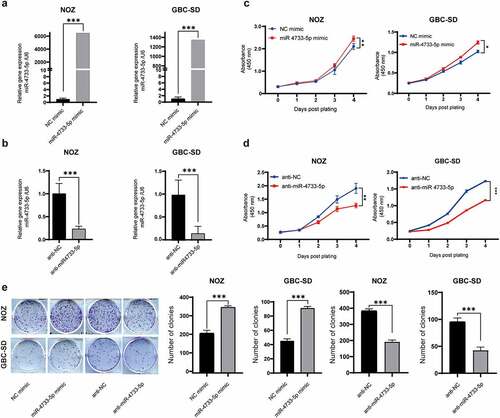
Figure 3. miR-4733-5p enhances GBC cell migration and invasion by EMT process. (a, b) Wound healing assay of GBC-SD cells transfected with miR-4733-5p mimic or inhibitor and the corresponding NC mimic or anti-NC. Representative images of colony formation assay (a), average percentage of closure of the scratch area was analyzed (b). (c, d) Invasion and migration (without Matrigel® matrix) assays of NOZ and GBC-SD cells transfected with miR-4733-5p mimic or inhibitor and the corresponding NC mimic or anti-NC. Representative images of colony formation assay, scale bar = 10 μm (c) and the cell count in each group was calculated in diagrams (d). (e) EMT-related protein (E-cadherin, N-cadherin and Vimentin) were examined by western blotting. Unpaired Student’ s t test was used in b and d (*p <0.05, **p <0.01, ***p <0.001).
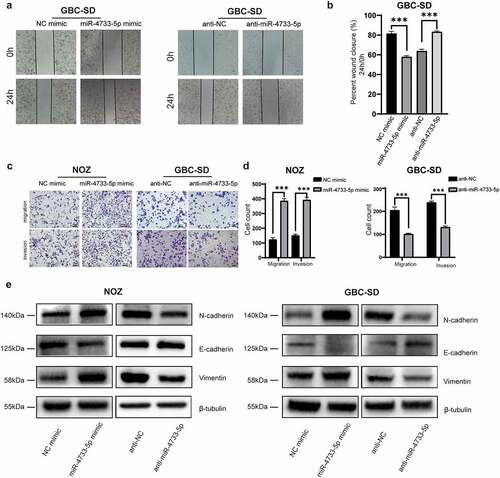
Figure 4. miR-4733-5p directly targets the 3’ UTR of KLF7 and downregulates its expression. (a) Veen diagram of possible target genes of miR-4733-5p predicted by five databases. The seven genes overlapped among these databases are listed in the right. (b) The RNA expression of seven predicted genes were examined in NOZ and GBC-SD cells transfected with miR-4733-5p inhibitor or anti-NC by RT–qPCR. (c, d) The RNA (c) and protein (d) expression of KLF7 was examined in NOZ and GBC-SD cells transfected with miR-4733-5p mimic or inhibitor and NC mimic or anti-NC by RT–qPCR and western blotting assay. (e) The relative luciferase activity was analyzed after co-transfected with KLF7 reporter plasmids and miR-4733-5p mimic into 293 T cells. The sequence of the potential miR-4733-5p binding sites in the 3’ UTR of KLF7 is shown in the left. Unpaired Student’ s t test was used in b, c, and e (ns: non-significant, *p <0.05, **p <0.01, ***p <0.001).
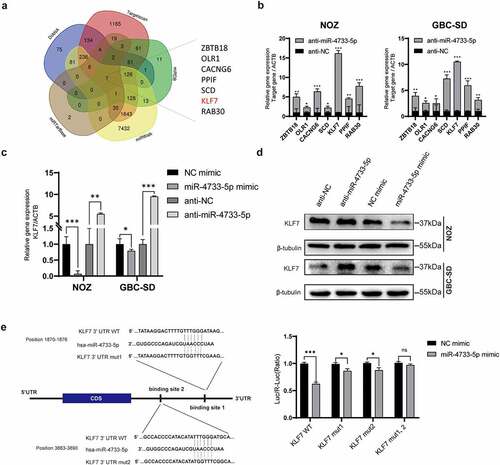
Figure 5. miR-4733-5p promotes GBC tumor growth in vivo. (a) The expression of miR-4733-5p (left) and KLF7 (right) in NOZ cells after stably transfected with LV3-miR-NC or LV3-miR-4733-5p inhibitor sponge. (b) Images of subcutaneous tumor in nude mice. (c, d) The tumor weight (c) and growth curve (d) of the xenograft tumors in each group. (e) Representative images of tumor slides were stained with hematoxylin and eosin or anti-KLF7 and anti-Ki-67 antibodies for IHC. Scale bar = 100 μm. Unpaired Student’ s t test was used in a, c and d (*p <0.05, **p <0.01, ***p <0.001).
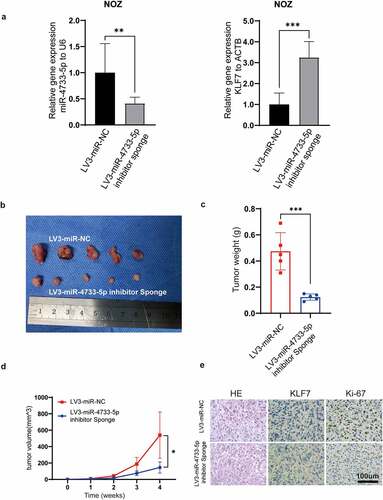
Figure 6. Inhibition of KLF7 in GBC enhances cell proliferation and migration. (a, b) The expression of KLF7 in 28 paired GBC and adjacent normal tissues by RT–qPCR (a) and western blotting (b). Representative images of western blotting are present (b). (c) The correlation between the expression of miR-4733-5p and KLF7 was analyzed using linear regression analysis (P = 0.0015, R = −0.5698; Pearson’s correlation). (d) Representative images of KLF7 expression in GBC and NGB tissues by IHC staining. Scare bar = 100 μm (left) and 50 μm (right). (e) The KLF7 expression in NOZ cells were examined by western blotting after overexpression (left) or downregulation (right) of KLF7. (f, g) Cell proliferation (f) and migration (g) abilities were evaluated in NOZ cells after overexpression or downregulation of KLF7, scare bar = 10 μm. Unpaired Student’ s t test was used in a, c and f (*p <0.05, **p <0.01, ***p <0.001).
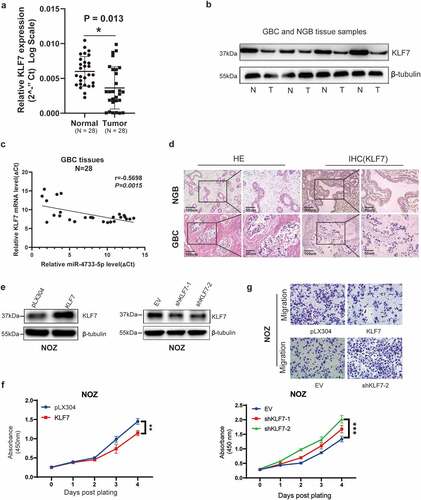
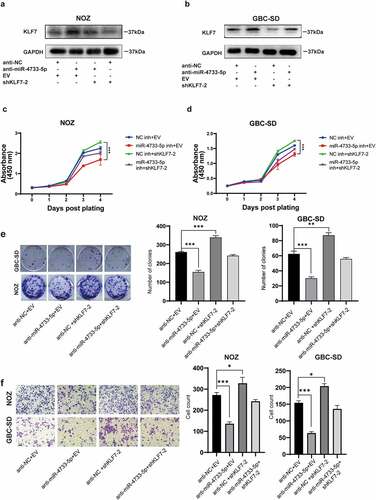
Figure 7. Knockdown of KLF7 abrogated the inhibition of anti-miR-4733-5p on GBC cells. (a, b) The KLF7 expression of NOZ and GBC-SD cells after transfected with anti-miR-4733-5p and shKLF7-2 plasmids. (c, d) Cell growth of NOZ and GBC-SD cells after co-transfection of anti-miR-4733-5p and shKLF7-2 plasmids. (e) Colony formation assays of NOZ and GBC-SD cells after co-transfection of anti-miR-4733-5p and shKLF7-2 plasmids. representative images of colony formation assay (left), the number of colonies in each group was counted in the diagrams (right). (f) Migration ability of NOZ and GBC-SD cells after co-transfection of anti-miR-4733-5p and shKLF7-2 plasmids. Representative images of migration assays were present (left) and cell count was calculated and analyzed (right). Unpaired Student’ s t test was used in c, d, e and f (*p <0.05, **p <0.01, ***p <0.001).
Supplemental Material
Download Zip (3.2 MB)Data availability statement
The miRNA microarray data were obtained from GEO database with accession number GSE104165 (https://www.ncbi.nlm.nih.gov/geo/). All data are available from the corresponding author on reasonable request.