Figures & data
Figure 1. The expression of cardiac Nesfatin-1 in control and type 2 diabetes (T2DB) mice. (a) mRNA level and (b) Protein level of Nesfatin-1 in the heart in control and diabetes mice. (****, P < 0.0001 vs. Vehicle group).
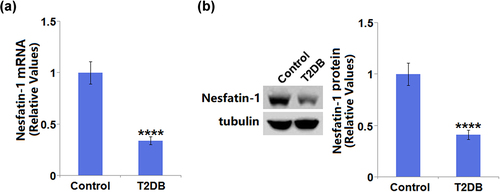
Figure 2. Effects of Nesfatin-1 on the indicators in the control and type 2 diabetes (T2DB) mice. (a) Changes in body mass over the period of T2DB induction. (b) Changes in body mass in T2DB upon nesfatin-1 treatment. (c) fasting blood glucose; (d) fasting insulin level; (e) insulin sensitivity; (f) total cholesterol; (g) triglycerides; (h) Serum low-density lipoprotein (LDL) level (**, ****, P < 0.01, 0.0001 vs. vehicle group; #, ##, P < 0.05, 0.01 vs. streptozotocin (STZ) mice).
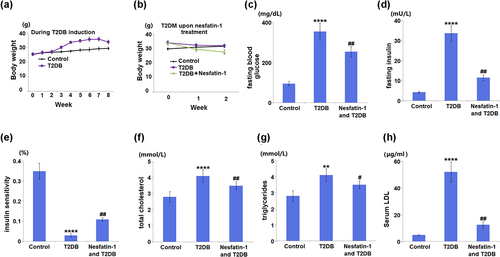
Figure 3. Effects of Nesfatin-1 on heart function in the control and type 2 diabetes (T2DB) mice. (a) Heart rate; (b) Creatine kinase-MB (CK-MB) level; (c) serum aspartate aminotransferase (AST) level; (d) mean arterial pressure (MAP) level (**, ****, P < 0.01, 0.0001 vs. vehicle group; #, ##, P < 0.05, 0.01 vs. streptozotocin (STZ) mice).
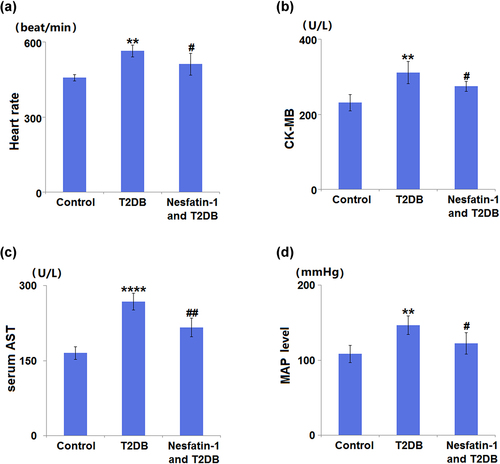
Figure 4. Protective effects of Nesfatin-1 on myocardial hypertrophy in type 2 diabetes (T2DB) mice. (a) Hypertrophy index; (b) Images of wheat germ agglutinin (WGA) staining in the cardiomyocyte cross-sectional area; (c) Quantification analysis of Cardiomyocyte area (****, P < 0.0001 vs. vehicle group; ## P < 0.01 vs. streptozotocin (STZ) mice).
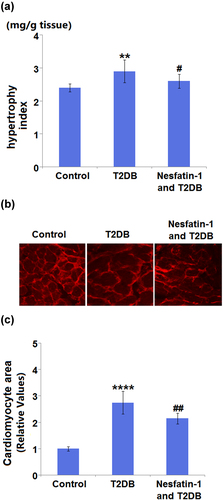
Figure 5. Nesfatin-1 reduces inflammation in type 2 diabetes (T2DB) mice. (a) ELISA results of cardiac interleukin-1 β (IL-1β) and cardiac tumor necrosis factor-α (TNF-α) levels; (b) ELISA results of plasma interleukin-1 β (IL-1β) and plasma tumor necrosis factor-α (TNF-α) (****, P < 0.0001 vs. vehicle group; ## P < 0.01 vs. streptozotocin (STZ) mice).
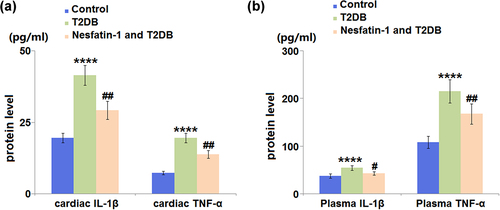
Figure 6. Nesfatin-1 reduces oxidative stress in type 2 diabetes (T2DB) mice. (a) Cardiac malondialdehyde (MDA) level; (b) Cardiac reactive oxygen species (ROS) levels; (c) Myocardial superoxide dismutase (SOD) levels; (d) Myocardial glutathione (GSH) levels (****, P < 0.0001 vs. vehicle group; ## P < 0.01 vs. streptozotocin (STZ) mice).
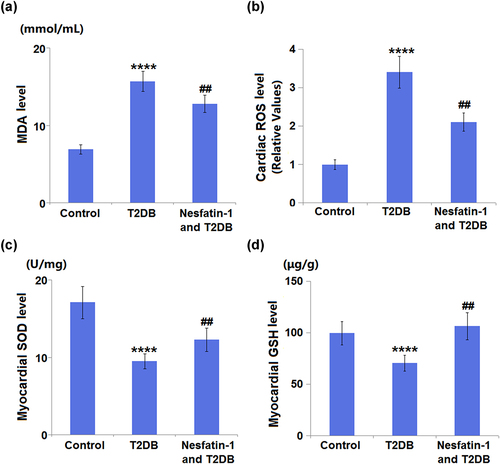
Figure 7. Nesfatin-1 increases the expression of glucagon-like peptide-1 (GLP-1) in the heart of type 2 diabetes (T2DB) mice. Western blots analysis of GLP-1 (****, P < 0.0001 vs. vehicle group; ## P < 0.01 vs. streptozotocin (STZ) mice).
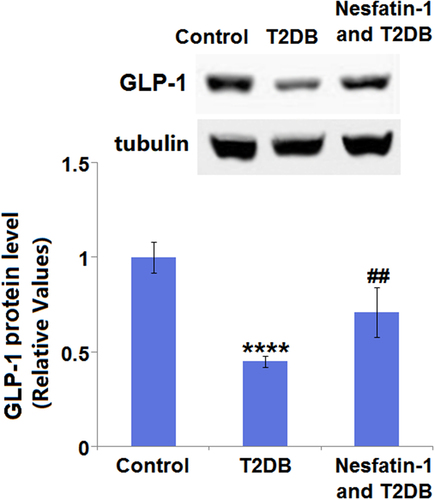
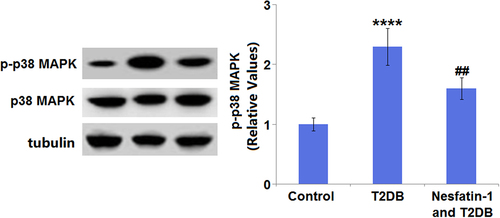
Figure 8. Nesfatin-1 protects cardiac damages in type 2 diabetes (T2DB) mice through the p38-mitogen-activated protein kinase (MAPK) pathway. Protein expression of p-p38-MAPK and total p38-MAPK (****, P < 0.0001 vs. vehicle group; ## P < 0.01 vs. streptozotocin (STZ) mice).