Figures & data
Table 1. Primer sequences
Figure 1. SUF inhibits miR-24-3p and accelerates HTR8/SVneo cell proliferation a-b: RT-qPCR detection of miR-24-3p; C: CCK8 test of HTR8/SVneo cell proliferation; d: Colony formation assay examination of HTR8/SVneo cells’ colony formation; e-f: Transwell detection of HTR8/SVneo cell invasion and migration; G: Flow cytometry test of HTR8/SVneo cell apoptosis. * P < 0.05, ** P < 0.01, *** P < 0.001 vs. the control; # P < 0.05, ## P < 0.01, ### P < 0.001 vs. the SUF + mimic NC. N = 3; Manifestation of the data in the figure was in the form of mean ± SD.
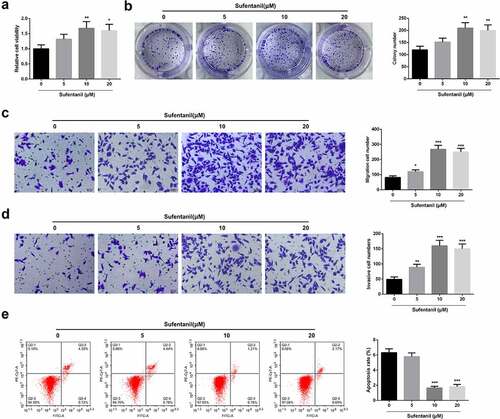
Figure 2. SUF accelerates HTR8/SVneo cell proliferation a: CCK8 detection of HTR8/SVneo cell proliferation; B: Colony formation assay test of HTR8/SVneo cells’ colony formation; c-d: Transwell examination of HTR8/SVneo cell invasion and migration; e: Flow cytometry test of HTR8/SVneo cell apoptosis. * P < 0.05, ** P < 0.01, *** P < 0.001. N = 3; Manifestation of the data in the figure was in the form of mean ± SD.
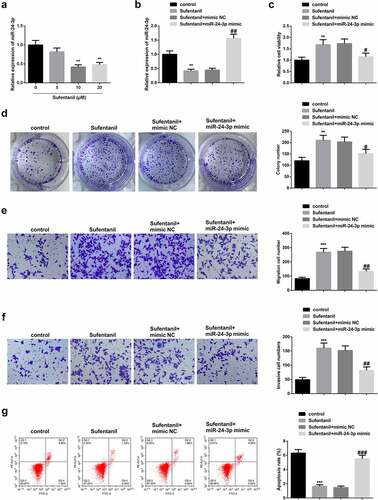
Figure 3. MiR-24-3p mimicking suppresses s HTR8/SVneo cell progression a: RT-qPCR detection of miR-24-3p; b: CCK-8 test of HTR8/SVneo cell proliferation; c: Colony formation assay examination of HTR8/SVneo cells’ colony formation; d-e: Transwell detection of HTR8/SVneo cell proliferation, invasion and migration; f: Flow cytometry test of HTR8/SVneo cell apoptosis. * P < 0.05, ** P < 0.01, *** P < 0.001 vs. the mimic NC; # P < 0.05, ## P < 0.01, ### P < 0.001 vs. the inhibitor NC. N = 3; Manifestation of the data in the figure was in the form of mean ± SD.
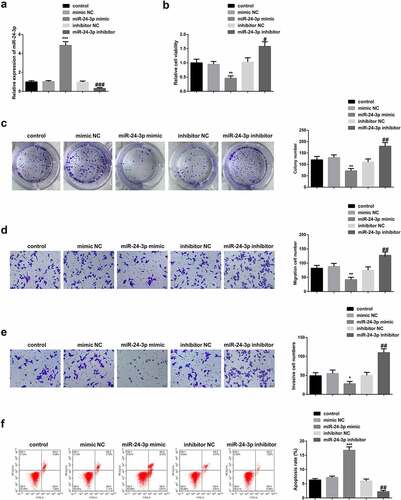
Figure 4. MiR-24-3p targets HSD11B2 in PE a: RT-qPCR detection of miR-24-3p and HSD11B2 in 35 PE patients and healthy patients’ peripheral blood, *** P < 0.001 vs. the Health; B: RT-qPCR test of miR-24-3p and HSD11B2 in HTR8/SVneo cells, N = 3, ** P < 0.01, *** P < 0.001 vs. the mimic NC, ## P < 0.01, ### P < 0.001 vs. the inhibitor NC; c: Bioinformatics website starbase prediction of binding sites of miR-24-3p with HSD11B2; d: The luciferase activity assay verification of the binding of miR-24-3p with HSD11B2; E: RIP examination of the binding of miR-24-3p with HSD11B2; Manifestation of the data in the figure was in the form of mean ± SD.
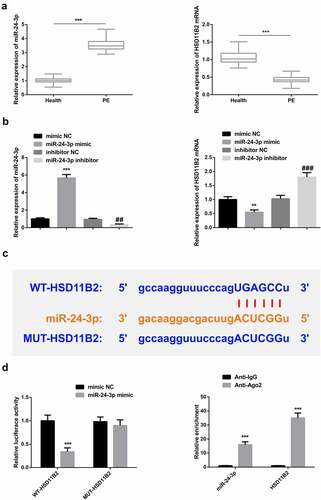
Figure 5. SUF reverses the inhibitory effects of miR-24-3p on HTR8/SVneo cell proliferation a-b: RT-qPCR/WB test of miR-24-3p and HSD11B2; c: CCK-8 detection of HTR8/SVneo cell proliferation; d: Colony formation assay detection of HTR8/SVneo cells colony formation; e-f: Transwell examination of HTR8 /SVneo cell invasion and migration; G: Flow cytometry test of HTR8/SVneo cell apoptosis. * P < 0.05, ** P < 0.01, *** P < 0.001 vs. the oe NC or control; # P < 0.05, ## P < 0.01, ### P < 0.001 vs. the oe HSD11B2 + miR-24-3p mimic. N = 3; Manifestation of the data in the figure was in the form of mean ± SD.
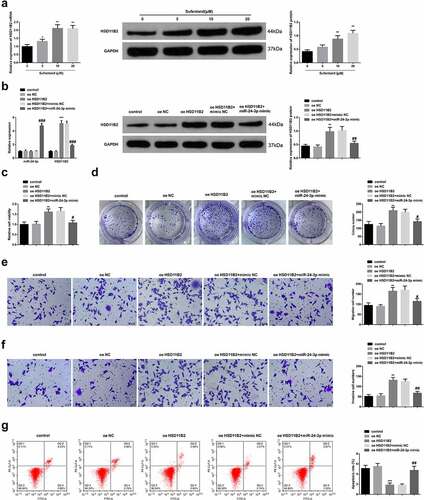
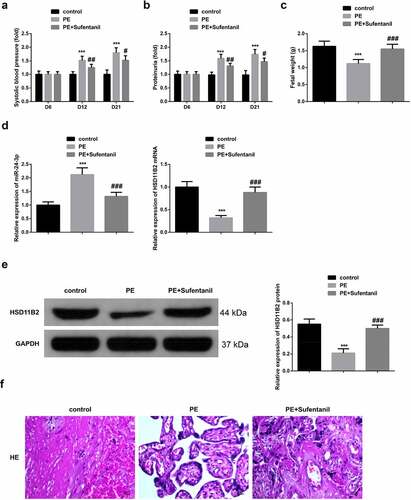
Figure 6. SUF suppresses PE progression in vivo via miR-24-3p/HSD11B2 axis a-b: Determination of rats’ SBP and 24 h proteinuria in different groups on the 6th, 12th and 21st d of pregnancy; c: Rats’ fetal weight in different groups; d: RT-qPCR detection of miR-24-3p and HSD11B2 of rat in each group; e: WB test of HSD11B2 of rats in each group; f: HE staining examination of placenta’s pathological changes of rats in each group (scale bar: 100 μm); *** P < 0.001 vs. the control; # P < 0.05, ## P < 0.01, ### P < 0.001 vs. the PE. N = 6; Manifestation of the data in the figure was in the form of mean ± SD.