Figures & data
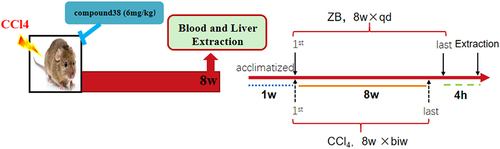
Figure 1. The selective BET inhibitor compound 38 inhibits the LPS-induced inflammatory response.
Figure 2. Compound 38 treatment attenuates inflammatory responses in the LPS/ GalN-induced acute liver injury (ALI) mouse model in vivo.
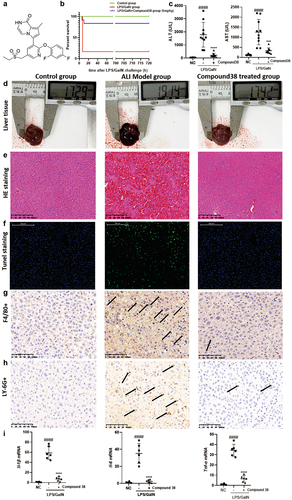
Figure 3. Compound38 inhibits pro-inflammatory gene expression and blocks the inflammatory pathway.
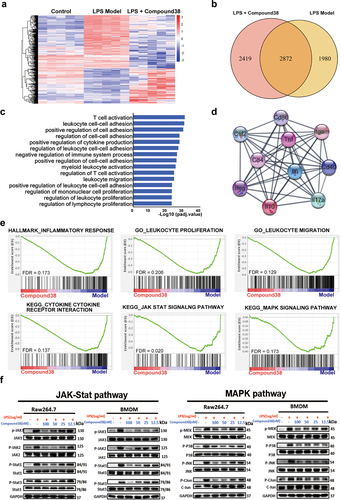
Figure 4. Compound 38 treatment inhibited hepatic stellate cell (HSC) activation.
Figure 5. Compound 38 treatment reduces liver inflammation and fibrosis.
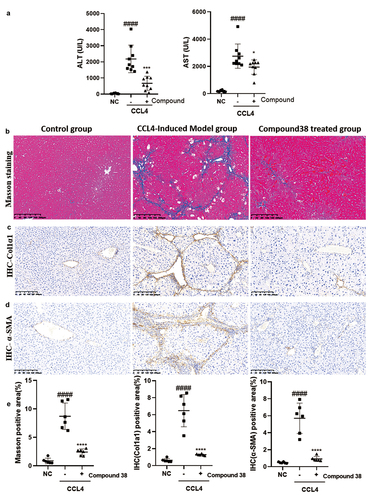
Figure 6. Compound 38 blocks fibrosis-related pathway activation in LX2 cells.
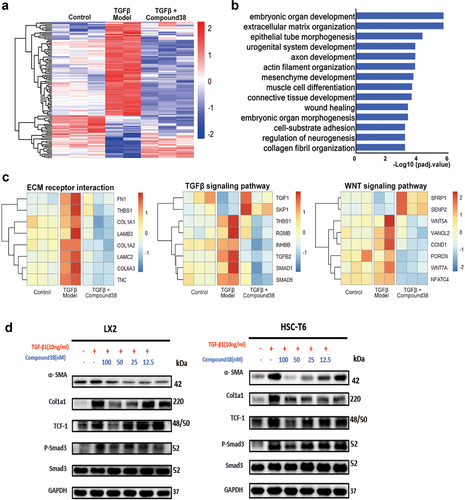
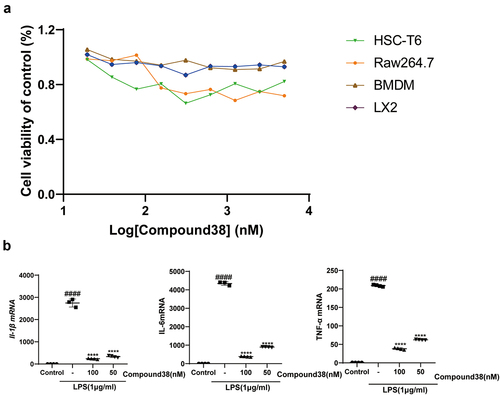
Figure 7. (a) The viability of four kinds of cells was assessed using the Cell Titer-Glo assay after 24-h administration by compound 38. (b) Four-hour administration with the selective BET inhibitor compound 38 downregulated the mRNA levels of Il-1β, Il-6, and Tnf-α in mouse Kupffer cells.*P < 0.05, **P < 0.01, ***P < 0.001, ****P < 0.0001 compared to the TGF-β-induced group. #P < 0.05, ##P < 0.01, ###P < 0.001, ####P < 0.0001 compared to the control group.